


By Joseph D’Aleo
See the compelling interview by David Kreutzer on Fox Business yesterday.
Obama announced yesterday he want to double down on the wind and solar energy initiative and criticized Romney for challenging that. Wind now provides 2.3% of the nation’s electricity needs but only because it was driven by the $100billion in subsidies much of which went to cronies of Obama (a blatant example of crony capitalism). Wind has been around since the ‘80s (1880’s) and solar the ‘90s (1890’s). They were going to be the future in the 1970s but 40 years later they can’t compete with fossil fuels because of the cost.
Also wind is an unreliable energy source like its brother solar. The wind doesn’t always blow, the sun doesn’t always shine. As a result where they have invested heavily in wind they have had to keep fossil fuel and other energy sources in inefficient ready back up to keep the power on. This has failed in Texas where they rely on energy from West Texas a few winters back when arctic air descended on the state, but winds diminished under high pressure in the west where the wind turbines were but kept blowing where the people were in the east, the lights went out. In December, 2010, the second coldest December in the UK since the Little Ice Age in 1659, wind power delivered just 0.6% of the energy needs as the cold arctic air was with calm winds much of the time.
Instead of a job creator, as part of the 4 million green energy jobs promised by Obama in 2008, that has been a dismal failure, creating a claimed 75,000 jobs according to AWEA (a number challenged here). In Spain, the original model for Obama and the greens, they invested heavily in wind and solar but prices rose so high, it drove industry to China and India. 2.2 jobs were lost for every 1 green job created and only 1 in 10 green jobs were permanent. In Italy, it was 3.4 real jobs lost for every green job created. In Spain, unemployment rose to 25.5%, highest of any country. Not a single fossil fuel power plant was shut down and CO2 emissions went up 50% not down. Spain bacause like Don Qiuixote went chasing wind mills, is technically bankrupt in part because of subsidies to renewable energies, which have increased the country’s sovereign debt by some 30 billion dollars to date, plus 8 billion more each year because the subsidies are guaranteed for 20 years. They produce the same amount of electricity as before, but it costs much more. Their 18,000 wind turbines haven’t even reduced the consumption of fossil fuels, because of problems caused by their intermittency have stopped the subsidies and had to be bailed out by Germany. Germany is another country which has seen the light and cut back on the subsidies and are busy building coal plants. They found wind and solar were inefficient and were at the mercy of the Russians for natural gas. In England, Chris Huhne, the disgraced energy secretary now departed had an energy plans that was causing energy prices to skyrocket 140% in just eight years . Fully a quarter of the homes in Wales and most pensioners were in energy poverty, having to choose between heating and eating. When the brutal winters of recent years hit, thousands died from illnesses related to cold exposure. You see higher energy costs is a very regressive ‘tax’ (because it is driven by government policy and bad science) affecting poor and middle class the most. Even where we able to keep the power on (and there would be many brownouts and blackouts - ok by enviro standards as they begrudge our use of energy for HD TV, AC and other conveniences), some people will have to dine by candlelight because they can’t afford to pay the electric bills.

WIND HAS PROVEN TO BE DEADLY
The Audobon Society had challenged its environmental brothers on wind, finding the wind turbines kills hundreds of thousands of birds, including ‘protected’ species like raptors and eagles. Ironically environmental groups went after Exxon and won $600,000 in penalties when 6 birds were found drowned in an oil tank but look the other way at the hundreds of thousands of dead birds killed by these monstrous bird cuisanarts.
WIND JOBS ARE NOT HERE..THEY ARE OUTSOURCED
Wind blades and cement is manufactured not in the United States but mostly in China. 100,000s of jobs are involved. Many of Obama subsidized solar companies like Solyndra have gone bankrupt. In the wind industry, there have been notable losses and job layoffs.Recently DMI released 383 employees, Vestas 272, LM wind power 234, Gamesa 164 jobs.
WIND IS A HEALTH HAZARD TO HUMANS
Dr. Bob McMurtry, a prominent member of the Canadian health establishment, joins the victims of industrial wind turbines (IWTs) in their call for Health Canada to turn over their future wind turbine noise study to Canadian Institutes of Health Research (CIHR). While the study is being conducted, they demand an immediate moratorium on all pending and proposed IWT projects. Residents near wind turbines report chronic inability to sleep, migraines and other ailments even heart attacks and suicides from the constant background hum from the turbines. The values of their homes have diminished. All for what ? Energy costs have gone up as quality of life has gone down.
WIND AND SOLAR ARE SUPPLEMENTAL SOURCES
Unlikely to rise out of the single digits in contribution to the energy needs unless we invest 1000s of billions of tex payer dollars but then then have to remember, the wind doesn’t alway blow, the sun doesn’t always shine. It may work when the farms are placed in remote location and noon will argue with someone for putting solar panels on their roofs to provide hot water and supplement other energy sources. But payback is 20 years unless we subsidize and no thanks count me out on subsidizing this investment. This administration and its band of idealogues wants to pick winners and losers instead of letting the market place do it. Natural gas and clean coal and the Keystone pipeline are no brainers if the administration only acted as it it had one. I will say I am not opposed to alternative energy. If a company develop a low cost solar panel I may someday buy one if I live long enough for that to happen.
On May 30, the Wall Street Journal alerted us to the Sierra Club’s new campaign aimed at killing the natural gas industry: “Beyond Natural Gas.” WSJ reports: “This is no idle threat. The Sierra Club has deep pockets funded by liberal foundations and knows how to work the media and politicians. As Marita Noon alerted u in the WSJ report, “The lobby helped to block new nuclear plants for more than 30 years, it has kept America’s energy policy is being dominated by environmentalists’ priorities--regardless of the impact to the American economy, individual communities, or economically-challenged citizens. The plans to shut down or limit America’s abundant, available, and affordable energy are organized, coordinated, and effective. The results will be “lights out in America--a dim future. Now much of the U.S. off-limits to oil drilling, and its ‘Beyond Coal’ campaign has all but shut down new coal plants. One of its priorities now will be to make shale gas drilling anathema within the Democratic Party.”
Meanwhile, while western Europe, realizing the failures of the green promise are rushing to build coal and gas power plants while Mr Obama’s administration doesn’t bother to study the real facts and make a decision that is right for the country instead of appealing to their lefty friends in Hollywood or the environmental groups and plans to double down on subsides with money we don’t have to technologies that have worldwide been proven failures and leave 100.000s or maybe millions of real jobs on the table in coal and natural gas and with the Keystone Pipeline. According to the latest forecasts from the Department of Energy in its latest Annual Energy Outlook, the fossil fuel (coal, natural gas and oil) share of energy consumption will fall only slightly in the future, from 83 percent of total U.S. energy demand in 2010 to 77 percent in 2035 (see chart). On the other hand, the future of renewables is not looking so bright, in terms of its future contribution to America’s energy demand. In 2010, renewables (wood, municipal waste, biomass, and hydroelectricity in the end-use sectors; hydroelectricity, geothermal, municipal solid waste, biomass, solar, and wind for generation in the electric power sector; and ethanol for gasoline blending and biomassd diesel in the transportation sector), contributed only about 7% of U.S. energy consumption, and that was less than the 8.9% share back in 1983. Even by 2035, more than twenty years from now, renewables as a fuel source are expected to provide less than 11% of total energy demand.
This issue is yet another issue why this election is so important in cleaning house in DC of the idealogues and replacing them with people with common sense, real ideas and solutions.
Dr. William Gray
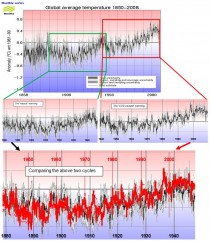
An important process with regards to climate change is the prevalence of naturally occurring multi-decadal periods of fluctuations in both global and local temperature, precipitation, and other climate elements. The usual period of these variations is about 50-70 years or roughly 25-35 years between low to high or high to low periods. The weather 25-35 years ago can often seem different from what we experience today. I have heard many adults say that the weather-climate now is different than when they were a kid. And this is often true. Such multi-decadal periods have always been part of the earth’s climate system. Such changes have been well documented backward in time for thousands of years in paleo-climate data sets of various types. For example, global cooling periods were experienced between 1880-1910, 1945-1975 and the slight global cooling that has been experienced since 1998. Periods of distinct global surface warming occurred between 1910-1940 and 1975-1998.
These changes in climate are hypothesized to be due to the natural back-and-forth swings of the globe’s deep ocean circulation patterns which are primarily driven by upper-ocean salinity differences. These salinity changes are caused by precipitation and evaporation differences on different time and space scales and have no direct association with CO2-induced radiation changes. The Anthropogenic Global Warming (AGW) advocates want us to believe that these natural multi-decadal changes have an important human component that is related to greenhouse gas buildup. This plays well into the hands of those not knowing the causes of such multi-decadal natural climate change.
Surface temperature measurements over the last 130 years have also indicated a weaker and longer multi-century period of upward mean global warming trend upon which the shorter and stronger up-and-down multi-decadal warming and cooling periods are superimposed. This longer and weaker multi-century global warming since the 19th century is also hypothesized to result from the multi-century slow-down of the global ocean’s Meridional Overturning Circulation (MOC) of which the Atlantic Ocean Thermohaline Circulation (THC) plays a major part along with the deep water subsidence surrounding the Antarctic continent. Both of these deep water formation areas are brought about by salinity variations (Figure 1). This long-period global surface temperature rise is also hypothesized to result from the globe’s climate slowly recovering from the Little Ice-Age period when the MOC was in a stronger mode.
The build-up of CO2 in the atmosphere since the start of the industrial revolution (150 years ago) has resulted in (if all other factors are held constant) a very small gradual build-up in the blockage of long-wave infrared radiation (IR) energy flux to space. Up to now this increasing CO2-induced IR blockage accounts for only about 0.6% (1.4 Wm-2 / 235 Wm-2) of the net balancing in-and-out radiation which our planet continuously receives in solar energy gain and simultaneously gives up as IR radiation energy loss to space. This CO2 influence is too small to be isolated in comparison with all of the other much larger global atmosphere-ocean energy changes involving clouds, rainfall, surface-atmosphere exchange, etc. Whatever the increasing CO2 influence is on our climate, it is very small and resides buried in our global climate’s fluctuating noise levels. It will be many decades before this very weak CO2 warming influence can ever be explicitly determined.
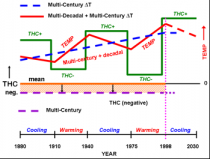
Figure 1. (enlarged) Idealized portrayal of the weaker long-term multi-century temperature increase of 0.6-0.7C that the globe has experienced since the later part of the 19th century (blue dashed line). This is hypothesized to be due to the long multi-century ocean Meridional Overturning Circulation (MOC) slow-down from its earlier period stronger state during the Little Ice Age. Superimposed on this recent long period multi-century ocean circulation warming of are shorter periods of stronger multi-decadal warming and cooling shown by the up-and-down red line. These changes are hypothesized to be driven by the shorter period multi-decadal variations in the salinity-induced strength of the Atlantic Ocean THC (green line). When the Atlantic THC is weak, the globe undergoes weak multi-decadal warming periods of 25-35 years. When the THC is strong the globe typically experiences weak multi-decadal cooling periods of this same approximate length.
The GCMs which say that CO2’s doubling (near the end of this century) will bring about a global warming of as much as 2-5C are badly flawed. All the GCMs have arbitrary and unrealistically incorporated large additional positive water vapor-enhanced warming into their simulations. These extra vapor warming inclusions are directly tied to CO2 increases. They are not at all realistic. My estimate of global warming for a doubling of CO2 is only about 10-15 percent ( around 0.4C) as much as the amount of warming that the global modelers’ project in their IPCC-AR4 report of about 3C.
The severe weather events we have observed over the last two years and this summer’s strong hot and dry conditions over parts of the US are well within the globe’s natural climate variability. Such hot and dry conditions were more extreme in the 1930s. There are many places on the globe right now that are experiencing cooler-than-normal temperatures and above-average precipitation.
We should not let the global warming alarmists, who know little about how the globe’s climate really functions, brainwash us into thinking that humans have had a significant influence on the recent unusual weather-climate events the US has been experiencing. Unusual weather-climate events have always occurred and will always continue to occur, irrespective of the amounts of CO2 we put into the atmosphere.
William M. Gray is professor emeritus at the Department of Atmospheric Science at Colorado State University.
From NASA: Research Links Extreme Summer Heat Events to Global Warming
A new statistical analysis by NASA scientists has found that Earth’s land areas have become much more likely to experience an extreme summer heat wave than they were in the middle of the 20th century. The research was published today in the journal Proceedings of the National Academy of Sciences.
Earth’s Northern Hemisphere over the past 30 years has seen more “hot” (orange), “very hot” (red) and “extremely hot” (brown) summers, compared to a base period defined in this study from 1951 to 1980. This visualization shows how the area experiencing ‘extremely hot’ summers grows from nearly nonexistent during the base period to cover 12 percent of land in the Northern Hemisphere by 2011. Watch for the 2010 heat waves in Texas, Oklahoma and Mexico, or the 2011 heat waves the Middle East, Western Asia and Eastern Europe. Credit: NASA/Goddard Space Flight Center Scientific Visualization Studio
Anthony comments on the NASA animation by Dr. James Hansen of surface temperature trends from 1955-1999:
There are many issues with this presentation. It seems to be a big Cherry Picking exercise.
1. Note all of the missing southern hemisphere data. There are operating weather stations during his time, but they are excluded from the analysis. Why?
2. The period chosen, 1955-1999 (in the bell curve animation) leaves out the warmer 1930′s and the cooler 2000′s. Why?
3. The period from 2000-present has no statistically significant warming. Leaving that period out (of the bell curve animation) biases the presentation.
4. The period chosen exhibits significant postwar growth, urbanization is not considered.
5. As for severe weather, Hansen ignores the fact that neither tornadoes nor hurricanes have shown any increase recently. Only smaller tornadoes show an increase, due to reporting bias thanks to easily affordable and accessible technology. NOAA’s SPC reports that July 2012 seems to be at a record low for tornadoes.
6. My latest results in Watts et al 2012 suggest surface station data may be biased warmer over the last 30 years.
The statistics show that the recent bouts of extremely warm summers, including the intense heat wave afflicting the U.S. Midwest this year, very likely are the consequence of global warming, according to lead author James Hansen of NASA’s Goddard Institute for Space Studies (GISS) in New York.
“This summer people are seeing extreme heat and agricultural impacts,” Hansen says. “We’re asserting that this is causally connected to global warming, and in this paper we present the scientific evidence for that.”
Hansen and colleagues analyzed mean summer temperatures since 1951 and showed that the odds have increased in recent decades for what they define as “hot,” “very hot” and “extremely hot” summers.
The researchers detailed how ‘extremely hot’ summers are becoming far more routine. ‘Extremely hot’ is defined as a mean summer temperature experienced by less than one percent of Earth’s land area between 1951 and 1980, the base period for this study. But since 2006, about 10 percent of land area across the Northern Hemisphere has experienced these temperatures each summer.
James Hansen and colleagues use the bell curve to show the growing frequency of extreme summer temperatures in the Northern Hemisphere, compared to the 1951 to 1980 base period. The mean temperature for the base period is centered at the top of the green curve, while hotter than normal temperatures (red) are plotted to theright and colder than normal (blue) to the left. By 1981, the curve begins to shift noticeably to the right, showing how hotter summers are the new normal. The curve also widens, due to more frequent hot events.
Comments from Anthony:
This bell curve proves nothing, as it has the same problems with data as the surface temperature visualization above: cherry picking period, missing data, and contradictory severe weather statistics. This is nothing but a political ploy from a man who has abandoned any pretext of professionally done science in favor of activism. However, in spite of this, it will be used as ‘proof’ by non-thinking individuals like Bill McKibben to promote a political end. Prepare for a barrage of such stories trying to link any observed weather aberration to climate. They’ll use the same level of fact checking like we saw with the melting street lamps last week.
In 1988, Hansen first asserted that global warming would reach a point in the coming decades when the connection to extreme events would become more apparent. While some warming should coincide with a noticeable boost in extreme events, the natural variability in climate and weather can be so large as to disguise the trend.
To distinguish the trend from natural variability, Hansen and colleagues turned to statistics. In this study, the GISS team including Makiko Sato and Reto Ruedy did not focus on the causes of temperature change. Instead the researchers analyzed surface temperature data to establish the growing frequency of extreme heat events in the past 30 years, a period in which the temperature data show an overall warming trend.
NASA climatologists have long collected data on global temperature anomalies, which describe how much warming or cooling regions of the world have experienced when compared with the 1951 to 1980 base period. In this study, the researchers employ a bell curve to illustrate how those anomalies are changing.
A bell curve is a tool frequently used by statisticians and society. School teachers who grade “on the curve” use a bell curve to designate the mean score as a C, the top of the bell. The curve falls off equally to both sides, showing that fewer students receive B and D grades and even fewer receive A and F grades.
Hansen and colleagues found that a bell curve was a good fit to summertime temperature anomalies for the base period of relatively stable climate from 1951 to 1980. Mean temperature is centered at the top of the bell curve. Decreasing in frequency to the left of center are “cold,” “very cold” and “extremely cold” events. Decreasing in frequency to the right of center are “hot,” “very hot” and “extremely hot” events.
Plotting bell curves for the 1980s, 1990s, and 2000s, the team noticed the entire curve shifted to the right, meaning that more hot events are the new normal. The curve also flattened and widened, indicating a wider range of variability. Specifically, an average of 75 percent of land area across Earth experienced summers in the “hot” category during the past decade, compared to only 33 percent during the 1951 to 1980 base period. Widening of the curve also led to the designation of the new category of outlier events labeled “extremely hot,” which were almost nonexistent in the base period.
Hansen says this summer is shaping up to fall into the new extreme category. “Such anomalies were infrequent in the climate prior to the warming of the past 30 years, so statistics let us say with a high degree of confidence that we would not have had such an extreme anomaly this summer in the absence of global warming,” he says.
Other regions around the world also have felt the heat of global warming, according to the study. Global maps of temperature anomalies show that heat waves in Texas, Oklahoma and Mexico in 2011, and in the Middle East, Western Asia and Eastern Europe in 2010 fall into the new “extremely hot” category.
PRESS RELEASE: July 29th, 2012 12PM PDT FOR IMMEDIATE RELEASE
By Anthony Watts
A reanalysis of U.S. surface station temperatures has been performed using the recently WMO-approved Siting Classification System devised by METEO-France’s Michel Leroy. The new siting classification more accurately characterizes the quality of the location in terms of monitoring long-term spatially representative surface temperature trends.
The new analysis demonstrates that reported 1979-2008 U.S. temperature trends are spuriously doubled, with 92% of that over-estimation resulting from erroneous NOAA adjustments of well-sited stations upward. The paper is the first to use the updated siting system which addresses USHCN siting issues and data adjustments.
The new improved assessment, for the years 1979 to 2008, yields a trend of +0.155C per decade from the high quality sites, a +0.248 C per decade trend for poorly sited locations, and a trend of +0.309 C per decade after NOAA adjusts the data. This issue of station siting quality is expected to be an issue with respect to the monitoring of land surface temperature throughout the Global Historical Climate Network and in the BEST network.
Today, a new paper has been released that is the culmination of knowledge gleaned from five years or work by Anthony Watts and the many volunteers and contributors to the SurfaceStations project started in 2007.
This pre-publication draft paper, titled An area and distance weighted analysis of the impacts of station exposure on the U.S. Historical Climatology Network temperatures and temperature trends, is co-authored by Anthony Watts of California, Evan Jones of New York, Stephen McIntyre of Toronto, Canada, and Dr. John R. Christy from the Department of Atmospheric Science, University of Alabama, Huntsville, is to be submitted for publication.
The pre-release of this paper follows the practice embraced by Dr. Richard Muller, of the Berkeley Earth Surface Temperature project in a June 2011 interview with Scientific American’s Michael Lemonick in “Science Talk”, said:
I know that is prior to acceptance, but in the tradition that I grew up in (under Nobel Laureate Luis Alvarez) we always widely distributed “preprints” of papers prior to their publication or even submission. That guaranteed a much wider peer review than we obtained from mere referees.
The USHCN is one of the main metrics used to gauge the temperature changes in the United States. The first wide scale effort to address siting issues, Watts, (2009), a collated photographic survey, showed that approximately 90% of USHCN stations were compromised by encroachment of urbanity in the form of heat sinks and sources, such as concrete, asphalt, air conditioning system heat exchangers, roadways, airport tarmac, and other issues. This finding was backed up by an August 2011 U.S. General Accounting Office investigation and report titled: Climate Monitoring: NOAA Can Improve Management of the U.S. Historical Climatology Network
All three papers examining the station siting issue, using early data gathered by the SurfaceStations project, Menne et al (2010), authored by Dr. Matt Menne of NCDC, Fall et al, 2011, authored by Dr. Souleymane Fall of Tuskeegee University and co-authored by Anthony Watts, and Muller et al 2012, authored by Dr. Richard Muller of the University of California, Berkeley and founder of the Berkeley Earth Surface Temperature Project (BEST) were inconclusive in finding effects on temperature trends used to gauge the temperature change in the United States over the last century.
Lead author of the paper, Anthony Watts, that:
“I fully accept the previous findings of these papers, including that of the Muller et al 2012 paper. These investigators found exactly what would be expected given the siting metadata they had. However, the Leroy 1999 site rating method employed, and employed in the Fall et al 2011 paper I co-authored was incomplete, and didnt properly quantify the effects.The new rating method employed finds that station siting does indeed have a significant effect on temperature trends”
Watts et al 2012 has employed a new methodology for station siting, pioneered by Michel Leroy of METEOFrance in 2010, in the paper Leroy 2010, and endorsed by the World Meteorological Organization (WMO) Commission for Instruments and Methods of Observation (CIMO-XV, 2010) Fifteenth session, in September 2010 as a WMO-ISO standard, making it suitable for reevaluating previous studies on the issue of station siting.
Previous papers all used a distance only rating system from Leroy 1999, to gauge the impact of heat sinks and sources near thermometers. Leroy 2010 shows that method to be effective for siting new stations, such as was done by NCDC adopting Leroy 1999 methods with their Climate Reference Network (CRN) in 2002 but ineffective at retroactive siting evaluation.
Leroy 2010 adds one simple but effective physical metric; surface area of the heat sinks/sources within the thermometer viewshed to quantify the total heat dissipation effect.
Using the new Leroy 2010 classification system on the older siting metadata used by Fall et al. (2011), Menne et al. (2010), and Muller et al. (2012), yields dramatically different results.
Using Leroy 2010 methods, the Watts et al 2012 paper, which studies several aspects of USHCN siting issues and data adjustments, concludes that:
These factors, combined with station siting issues, have led to a spurious doubling of U.S. mean temperature trends in the 30 year data period covered by the study from 1979 to 2008.
Other findings include, but are not limited to:
· Statistically significant differences between compliant and non-compliant stations exist, as well as urban and rural stations.
· Poorly sited station trends are adjusted sharply upward, and well sited stations are adjusted upward to match the already-adjusted poor stations.
· Well sited rural stations show a warming nearly three times greater after NOAA adjustment is applied.
· Urban sites warm more rapidly than semi-urban sites, which in turn warm more rapidly than rural sites.
· The raw data Tmean trend for well sited stations is 0.15C per decade lower than adjusted Tmean trend for poorly sited stations.
· Airport USHCN stations show a significant differences in trends than other USHCN stations, and due to equipment issues and other problems, may not be representative stations for monitoring climate.
A comparison and summary of trends is shown in Figure 20 from the paper (enlarged):
We will continue to investigate other issues related to bias and adjustments such as TOBs in future studies.
FILES:
This press release in PDF form: Watts_et_al_2012-PRESS RELEASE-R1 (PDF)
The paper in draft form: Watts-et-al_2012_discussion_paper_webrelease (PDF)
The Figures for the paper: Watts et al 2012 Figures and Tables (PDF)
A PowerPoint presentation of findings with many additional figures is available online.
Overview of the paper (PPT)
Methodology Graphs Presentation (.PPT)
Some additional files may be added as needed.
Contact:
Anthony Watts at: http://wattsupwiththat.com/about-wuwt/contact-2/
References:
GAO-11-800 August 31, 2011, Climate Monitoring: NOAA Can Improve Management of the U.S. Historical Climatology Network Highlights Page (PDF) Full Report (PDF, 47 pages) Accessible Text Recommendations (HTML)
Fall, S., Watts, A., Nielsen‐Gammon, J. Jones, E. Niyogi, D. Christy, J. and Pielke, R.A. Sr., 2011, Analysis of the impacts of station exposure on the U.S. Historical Climatology Network temperatures and temperature trends, Journal of Geophysical Research, 116, D14120, doi:10.1029/2010JD015146, 2011
Leroy, M., 1999: Classification d’un site. Note Technique no. 35. Direction des Systemes d’Observation, Meteo-France, 12 pp.
Leroy, M., 2010: Siting Classification for Surface Observing Stations on Land, Climate, and Upper-air Observations JMA/WMO Workshop on Quality Management in Surface, Tokyo, Japan 27-30 July 2010 PDF
Menne, M. J., C. N. Williams Jr., and M. A. Palecki, 2010: On the reliability of the U.S. surface temperature record, J. Geophys. Res., 115, D11108, doi:10.1029/2009JD013094
Muller, R.A., Curry, J., Groom, D. Jacobsen, R.,Perlmutter, S. Rohde, R. Rosenfeld, A., Wickham, C., Wurtele, J., 2012: Earth Atmospheric Land Surface Temperature and Station Quality in the United States. PDF
Watts, A., 2009: Is the U.S. surface temperature record reliable? Published online.
World Meteorological Organization Commission for Instruments and Methods of Observation, Fifteenth session, (CIMO-XV, 2010) WMO publication Number 1064, available online.
Notes:
1. The SurfaceStations project was a crowd sourcing project started in June 2007, done entirely with citizen volunteers (over 650), created in response to the realization that very little physical site survey metadata exists for the entire United States Historical Climatological Network (USHCN) and Global Historical Climatological Network (GHCN) surface station records worldwide. This realization came about from a discussion of a paper and some new information that occurred on Dr. Roger Pielke Sr. Research Group Weblog. In particular, a thread regarding the paper: Pielke Sr., R.A., C. Davey, D. Niyogi, S. Fall, J. Steinweg-Woods, K. Hubbard, X. Lin, M. Cai, Y.-K. Lim, H. Li, J. Nielsen-Gammon, K. Gallo, R. Hale, R. Mahmood, R.T. McNider, and P. Blanken, 2007: Unresolved issues with the assessment of multi-decadal global land surface temperature trends. J. Geophys. Res.
------------
AMSs reaction to Watt’s paper
By Roger Pielke Sr., Climate Science Blog
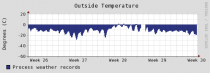
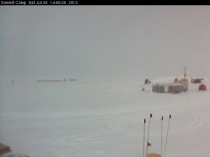
source of image: Greenland Summit Station - the plot is of temperatures at the top of the Greenland icecap for the last 30 days.
The current webcam image from this location can be viewed here.
There is a news report by Seth Borenstein titled
NASA: Sudden Massive Melt in Greenland
which reads in part [headline added]
Nearly all of Greenland’s massive ice sheet suddenly started melting a bit this month, a freak event that surprised scientists.
The ice melt area went from 40 percent of the ice sheet to 97 percent in four days, according to NASA. Until now, the most extensive melt seen by satellites in the past three decades was about 55 percent.
Wagner said researchers don’t know how much of Greenland’s ice melted, but it seems to be freezing again.
Summer in Greenland has been freakishly warm so far. That’s because of frequent high pressure systems that have parked over the island, bringing warm clear weather that melts ice and snow, explained University of Georgia climatologist Thomas Mote.
He and others say it’s similar to the high pressure systems that have parked over the American Midwest bringing record-breaking warmth and drought’
The news headline, in particular, is an example of media hype. There was no “massive melt”. The term “massive” implies that the melt involved large masses of the Greenland icecap. They could have written “Sudden Extensive, Short-Term Surface Melting On the Greenland Icecap”, but instead chose to overstate what is a short-term weather event. Melting of surface ice occurs in Greenland whenever there are relatively warm surface air temperatures, as shown in the plot from Summit Station at the top of this post, and sunny skies, as reported by Thomas Mote in Seth’s article. Almost anytime, sublimation (direct transfer from ice to water vapor) occurs.
There has been widespread media reporting of this melting (e.g. Fox News, MSNBC), but the real news story is the overstatement of this weather event by the media (and some scientists at NASA). The headline is the biased part of the article, which Seth may not have much control on, but, regardless, this biased misleading headline needs to be identified.
-------------
By the way, Greenland could from the 1940s to the mid 1990s as CO2 rose. It was only when the Atlantic Multidacadal Oscillation meant warming Atlantic waters, the the warming seen in the early 20th century repeated. It was warmer in the 1940s than currently. Of course to the climate clowns, the world started in 1970.
By Joseph D’Aleo, CCM, Weatherbell Co-Chief Meteorologist
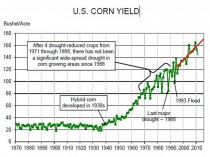
Texas started it all last year, and the palpable pain they felt that was so apparent in the comments received on the Weatherbell site, has spread north like a disease. The Midwest is where the blistering heat has focused this year. The drought is significant and has decimated the corn crop. It is the worst drought since 1988, when corn crop yields fell 30% below trend line yields.
It is driven by the warm pool northwest of Hawaii, the relative warmth NINO12 (+1.1C) versus the NINO34 (+0.5C) (we explain how these two factors are keys on Weatherbell.com) and antecedent conditions.
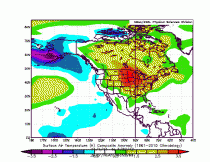
It was a warm dry zonal winter with the cold trapped in Alaska (still is). The pattern is stuck and persistent. This is the November 2011 to July 22, 2012 anomaly for North America.
The worst droughts for Texas were in 1918, 1956 and 2012, according to Texas State Climatologist Nielsen-Gammon. Those three years 1918, 1956 and 2012 were the strongest La Ninas according to the MEI and SOI. See how this two year bottomed just above 1956’s summer MEI.

Enlarged
In the extended MEI series see 1918 was right there with 1956, 2012. La Ninas mean dry for Texas, super La Ninas super dry. Super dry mean super hot.

You can see the clustering of drought years for Texas in the 1950s and in the 1930s in the graph that follows. For the United States as a whole the 1930s was the worst decade for drought - The Dust Bowl Years. Again here 1918, 1956 and 2012 stand out. The trend is actually up.

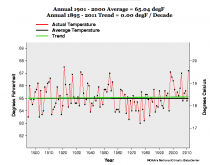
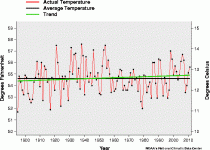
Summer heat the last century peaked in 1934, 1980 and 1998 and then 2011 in Texas with no discernable trend since 1895. This is the summer anomalies for Texas through 2011.

The annual trend is 0.00F/decade.
Enlarged
During the 1930s drought, the persistent dryness in the south central built the central heat ridge further and further north eventually setting all time records in many states.


Technically, the driest region of the Plains - southeastern Colorado, southwest Kansas and the panhandles of Oklahoma and Texas - became known as the Dust Bowl, and many dust storms started there. But the entire region, and eventually the entire country, was affected.

Enlarged
The Dust Bowl got its name after Black Sunday, April 14, 1935. More and more dust storms had been blowing up in the years leading up to that day. In 1932, 14 dust storms were recorded on the Plains. In 1933, there were 38 storms. By 1934, it was estimated that 100 million acres of farmland had lost all or most of the topsoil to the winds. By April 1935, there had been weeks of dust storms, but the cloud that appeared on the horizon that Sunday, the 14th, was the worst. Winds were clocked at 60 mph. Day became night.

Enlarged
The day after Black Sunday, an Associated Press reporter used the term “Dust Bowl” for the first time. In the central and northern plains, dust was everywhere. The dust bowl was caused not just by the dry weather but also by unwise farming practices. Earlier settlers plowed under the natural tall grasses that covered the plains and planted crops they had planted in the wetter East. When the drought came, the crops failed, the ground was uncovered and the incessant winds produced the dust storm. After the dust bowl, farmers ended over-cropping, over-grazing and improper farm methods. Since then wheat which is tolerant of drier conditions was grown in the semiarid west and other crops further east.
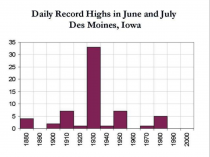
Dry ground enhances heat. Heat can expand north and east (sometimes even west). This can be clearly seen in the plot of record highs for Des Moines, Iowa for June and July. Note 33 of the records were in the 1930s and interestingly none since 1988 until this year when 2 or 3 were tied or set. With the heat ridge nearby, until it rains, more records could fall. We will update this chart in September when we look back on the summer sizzle. The 1930s will still dominate.
Enlarged
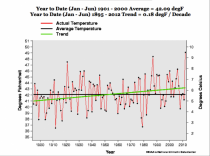
The Iowa first six months of 2012 was the warmest, a touch ahead of 1988 and 1921.
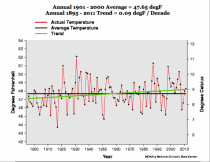
The annual trend is less by a factor of two. We can see the 60 year cycle. We also note, urbanization and land use changes are not adjusted for.
Enlarged
Missouri is ground zero this year and they are similar. First in the January to June averages. the second the annual.

Enlarged
In the annual the 1930s to 1950 dominated with warmth. The positive trend comes from the cold years at the start, the relative secondary max at the end of the record.
Enlarged
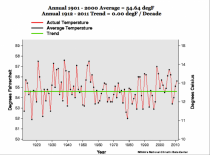
Indeed if you go back 100 years, the trend is 0.00F/decade for annual temperatures in Missouri.
This is true actually for all the states. The 1930s show the most state all-time record highs than any other decade, the 1950s second. The cold records actually peaked in the 1980s and 1960s.


The warmest, droughtiest decades are those with a warm Atlantic (+AMO). The 1930s had a warm Pacific (+PDO) with one important exception 1934. The 1950s like the last three years have had a cold Pacific (- PDO).
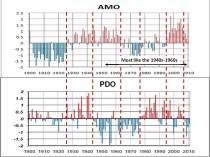
The importance of the AMO to drought 9and thus heat) was shown by McCabe (2004):

Drought frequencies are highest (reds) in the AMO states (two right maps). The PDO determines the region. We are bottom right this year.
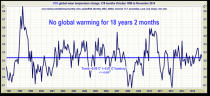
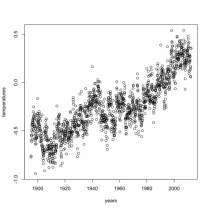
One last chart...the US is only a small part of the earth’s surface (less than 2%). There has been no warming for over a dozen years.

UPDATE:
COLD SUMMER IN ALASKA
Gloomy summer headed toward infamy CHILLY: Anchorage could hit 65 degrees for fewest days on record.
By GEORGE BRYSON gbryson@adn.com
Published: July 24th, 2008 12:10 AM Last Modified: July 24th, 2008 04:56 PM
The coldest summer ever? You might be looking at it, weather folks say. Right now the so-called summer of ‘08 is on pace to produce the fewest days ever recorded in which the temperature in Anchorage managed to reach 65 degrees. That unhappy record was set in 1970, when we only made it to the 65-degree mark, which many Alaskans consider a nice temperature, 16 days out of 365.This year, however—with the summer more than half over—there have been only seven 65-degree days so far. And that’s with just a month of potential “balmy” days remaining and the forecast looking gloomy.
National Weather Service meteorologist Sam Albanese, a storm warning coordinator for Alaska, says the outlook is for Anchorage to remain cool and cloudy through the rest of July."There’s no real warm feature moving in,” Albanese said. “And that’s just been the pattern we’ve been stuck in for a couple weeks now.
“In the Matanuska Valley on Wednesday snow dusted the Chugach. On the Kenai Peninsula, rain was raising Six-Mile River to flood levels and rafting trips had to be canceled.So if the cold and drizzle are going to continue anyway, why not shoot for a record?
The mark is well within reach, Albanese said: “It’s probably going to go down as the summer with the least number of 65-degree days.
“MEASURING THE MISERY In terms of “coldest summer ever,” however, a better measure might be the number of days Anchorage fails to even reach 60.There too, 2008 is a contender, having so far notched only 35 such days—far below the summer-long average of 88.Unless we get 10 more days of 60-degree or warmer temperatures, we’re going to break the dismal 1971 record of only 46 such days, a possibility too awful to contemplate.
Still, according to a series of charts cobbled together Tuesday evening by a night-shift meteorologist in the weather service’s Anchorage office, the current summer clearly has broken company with the record-setting warmth of recent years. Consider: 70-degree days. So far this summer there have been two. Usually there are 15. Last year there were 21. In 2004 there were 49. 75-degree days. So far this summer there’s been zero. Usually there are four. It may be hard to remember, but last year there were 21. In 2004 there were 23.
---------
By Katie Medred, Alaska Dispatch
In Interior Alaska summer feels like it’s over. Meanwhile, Southcentral Alaska is in the middle of possibly the chilliest July ever, while Southeast has mournfully reported the lowest summer-time temperature recorded in over 65 years.
So how are residents of the icebox handling this “coldest-Alaskan-summer-ever” talk while many in the Lower 48 sizzle in record heat? After all, don’t Alaskans say this every summer?
KTUU reports that some residents are so fed up they’re looking for ways to get out of state in a quest for more sun.
The Fairbanks Daily News-Miner expresses resentment over this summer’s consecutive 60-degree days in Alaska’s second-largest city, which is normally known for 80 and 90s in the summer.
And then there’s Barrow, which as of July 15, has received the tell-tale sign of summer’s end—termination dust.
According to Sarah Nicely, program administrator at the North Slope Borough Mayor’s Office, there had been talk that it might snow around America’s northernmost town, but no one was seriously prepared for the dusting.
“I was leaving the mayor’s office to head on over to a camp and, as I was pulling out, I looked and I thought, ‘What is that?’” she told Alaska Dispatch’s Jill Burke. “I (had thought) it was going to rain, but I realized, ‘Oh my goodness, it’s snow!’”
----------
Joe Bastardi Puts The Heatwave In Perspective
Posted on July 22, 2012
Real Science Guest Post By Joe Bastardi
----------
Any of the Climate Clown Media sheep stop to think about this
The map below shows the Alaska imprinted on the US, in the area where the heat wave is worst, and then the July temps in North America showing that the Alaskan cold is at least holding its own, and arguably outdueling the US warmth. This is much like the pattern in the 1950s.
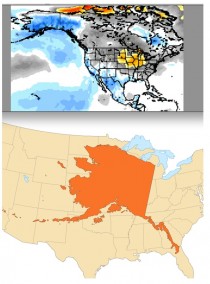
The question is will the Media swallow and follow sheep ever wake up and do a lick of digging into this, or keep marching along like drones to a drumbeat of mindless drivel. How not one of the mainstream climate writers that buy into AGW dont stop and look at the loads of information that should make them question this shows mindless blindness.
Heh I like that mindless blindness. Has a nice ring to it
by E. Calvin Beisner, Master Resource, July 18, 2012
“When I attended the United Nations climate summit in Copenhagen in 2009, the most common sign I saw carried by the 40,000-plus protesters in the streets (of whom the two largest groups were the International Socialist Youth Movement and the Community Party) said, ‘System change, not climate change’ - -i.e., give us global socialism, not global free markets!”
If you believe global warming is cyclical and mostly natural; human contribution is minor and not dangerous; and attempting to prevent human influence by cuts in carbon-dioxide emissions would cost trillions of dollars, trap billions of people in developing countries in poverty, and so do more harm than good, then you must be armed and prepared to act in our political times.
President Barack Obama, indeed, has warned us by saying that “he most important policy he could address in his second term is climate change.”
The Challenge Before Us
“Climate change” - what proponents called “global warming” before the globe stopped warming 17 years ago - has become the mother of all excuses for spending trillions of dollars, killing millions of jobs, trapping billions of people in poor countries in poverty, expanding governments control over our lives, and creating distant, unaccountable, global government.
As University of East Anglia Professor of Climate Change and Marxist/socialist Mike Hulme, a vigorous proponent of “post-normal science,” put it in his book, Why We Disagree about Climate Change:
The function of climate change I suggest, is not as a lower-case environmental phenomenon to be solved...It really is not about stopping climate chaos. Instead, we need to see how we can use the idea of climate change- the matrix of ecological functions, power relationships, cultural discourses and materials flows that climate change reveals - to rethink how we take forward our political, social, economic and personal projects over the decades to come.
Climate change has become an idea that now travels well beyond its origins in the natural sciences...climate change takes on new meanings and serves new purposes...climate change has become “the mother of all issues”, the key narrative within which all environmental politics - from global to local - is now framed… Rather than asking how do we solve climate change?” we need to turn the question around and ask: “how does the idea of climate change alter the way we arrive at and achieve our personal aspirations...?”
Little wonder that when I attended the United Nations climate summit in Copenhagen in 2009, the most common sign I saw carried by the 40,000-plus protesters in the streets (of whom the two largest groups were the International Socialist Youth Movement and the Community Party) said, “System change, not climate change” - i.e., give us global socialism, not global free markets!
Having failed to get cap-and-trade through Congress, Obama, true to his observation that “there’s more than one way to skin a cat,” had his Environmental Protection Agency act to impose Draconian measures on us by first “finding” that CO2 - a natural compound essential life, expelled with every breath - is a “dangerous pollutant” because it causes global warming, and then imposing restrictions on its emissions, first from vehicles, then from stationary sources like electric power plants.
Though not ruling on the scientific merits of EPA’s climate alarmism, the nation’s courts have so far rejected legal challenges to EPA’s actions. So the result, if such policies are not reversed by Congress, will be trillions of dollars in lost economic production and millions of lost jobs in the next two decades, and, much sooner, the skyrocketing electricity prices Obama promised during his campaign, and consequently rising prices for everything produced and transported using electricity - which is just about everything.
Challenging Church Environmental Hype/Alarmism
Last month, a three-part series, “Evangelicals and Climate Change” (June 12, June 20, and June 27), explained the role of the Cornwall Alliance as the leading voice for evangelicals who reject climate alarmism and strive to protect the world’s poor from harmful, and futile, efforts to fight global warming.
The Christian Post cited our Evangelical Declaration on Global Warming, endorsed by hundreds of evangelical scientists, economists, theologians, and other leaders and based on our landmark study, A Renewed Call to Truth, Prudence, and Protection of the Poor: An Evangelical Examination of the Theology, Science, and Economics of Global Warming, as representing not only Cornwall’s thought but also that of many other evangelicals, including the Southern Baptist Convention, America’s largest evangelical denomination.
The Other Side
But we face an uphill battle in the religious community. Climate alarmism has powerful, well-funded voices seeking to influence the evangelical community. Consider what we are trying to counter:
· The Evangelical Climate Initiative, launched with a $475,000 grant from population control-advocating Hewlett Foundation, continues to present its alarmist view as the dominant evangelical position - despite the Cornwall Alliance’s having refuted its science and economics point-by-point in A Call to Truth, Prudence, and Protection of the Poor: An Evangelical Response to Global Warming.
· The Evangelical Environmental Network, heavily funded by the population control-advocating Rockefeller Brothers Fund, has equated support for CO2 emission restrictions with being “pro-life,” obscuring the meaning of “pro-life,” threatening to divide the pro-life vote, and risking leaving Congress in control of pro-abortion forces for decades to come - despite the Cornwall Alliance’s having produced Protecting the Unborn and the Pro-Life Movement from a Misleading Environmentalist Tactic: A Joint Statement by Pro-Life Leaders, repudiating EEN’s similar claim with regard to mercury emissions.
· Former National Association of Evangelicals Vice President for Government Affairs Richard Cizik, with major financial assistance from billionaire Left-wing media mogul and population-control advocate Ted Turner’s United Nations Foundation and billionaire Left-wing globalist George Soros continues to promote government family planning programs as both “godly and green” ways to fight global warming.
· Socialist Jim Wallis’s Sojourners, also with heavy funding from Soros, this year hired a director of climate change campaigns to enlarge its influence.
The Cornwall Alliance, like many other sound-science and sound-economics groups, has much work to do to counter-climate alarmism and other environmental hype. Understanding not just the science, economics, and politics of the climate-change battle but also underlying worldview and ethical issues is crucial to winning this fight and keeping churches from having their message and mission compromised by a movement that undermines their foundational beliefs.
- - - -
E. Calvin Beisner, Ph.D., is Founder and National Spokesman of The Cornwall Alliance for the Stewardship of Creation. A coalition of theologians, pastors, ministry leaders, scientists, economists, policy experts, and committed laymen, the Cornwall Alliance is the worlds leading evangelical voice promoting environmental stewardship and economic development built on Biblical principles.
By Lucia, the Blackboard
Update: I said if I found temperature for the lower 48 I’d run them. I did and it totally revised my conclusions. It seems white noise isn’t such a bad assumption for temperatures in the lower 48, and the probability of the recent event really is quite low. I revised at the end!
-----
At wunderground.com Jeff Masters writes
U.S. heat over the past 13 months: a one in 1.6 million event
I call BS on that claim.
He goes on:
Each of the 13 months from June 2011 through June 2012 ranked among the warmest third of their historical distribution for the first time in the 1895 - present record. According to NCDC, the odds of this occurring randomly during any particular month are 1 in 1,594,323. Thus, we should only see one more 13-month period so warm between now and 124,652 ADassuming the climate is staying the same as it did during the past 118 years. These are ridiculously long odds, and it is highly unlikely that the extremity of the heat during the past 13 months could have occurred without a warming climate.
What this really is is a meaningless statistics.
Let’s look at how it is computed.
Someone assume we have an unfair coin and the probability of getting heads is 1/3rd. What are the chances of getting 13 heads in a row? The answer is 1 in 313 = 1 in 1,594,323.
Okey. Dokey.
Here’s the problem: That calculation only applies to cases where the results for each coin flip are statistically independent or at least uncorrelated. This would make sense if we believed that month-to-month variations in temperature anomalies could be described by something called “white noise”.
But this is not true for monthly temperature and would not be even absent climate change. We know that month-to-month variations in temperature are correlated. This is so well understood that NOAA has names for large persistent weather patterns. Names like “El Nino/La Nina” (i.e. ENSO). Other persistent weather patterns exist.
In fact - the entire reason weather forecasting is possible at all is that we know weather patterns persist. Masters calculation is based on the assumption weather patterns do not persist!.
Let’s tweak Dr. Master’s rather imperfect calculation by retaining his assumption that “climate is staying the same as it did during the past 118 years” but accounting for “persistence”. More specifically we will assume that there is non-zero serial auto-correlation in the monthly data. Since he used “white” noise, I’m going to pick the next simplest model: Red noise (i.e. AR1 noise.)
Master’s used continental US data. Because I have easy access to NOAA’s global data and have already coded a script to read it, I’ll use global data instead of data for the lower 48. (If someone gets me data for the continental US, I’ll repeat in an update.)
I start by downloading data from Jan. 1895 to Jun. 2012 from NOAA here.
I fit a model that assumed the temperature exihibits no systematic trend and with monthly variability modeled by “red” noise, (instead of Master’s choice of “white"). Doing so I estimate a lag 1 coefficient of R=0.936.
Next, I create a series of 1409 ‘months’ worth of data synthetic “weather” that is nothing more than “red noise”. I inspect the final 13 months to see if the minimum value is in the top 1/3rd of temperature based on the temperature record - but excluding the final 13 months themselves. If all thirteen months are in the top 1/3rd, the outcome for this case is 1. Otherwise, it’s 0.
Then, confident that it will not take 1,594,323 tries to end the string with a record, I repeated this computation 10^4 times. This results in a string of 10,000, 0s and 1s. Taking the mean of the series, I found that “assuming the climate is staying the same as it did during the past 118 years” the probability of 10% plus/minus 0.4% the final 13 months would fall in the top 1/3rd of historic temperatures observations.
Note that 1 in 10 times is much more likely than 1 in 1,594,323.
And my calculation is for the entire surface of the earth. I’m not cherry picking by finding the one country that happens to be having a sustained heat wave while other parts of the world are not experiencing the same heat wave.
So, what does the 10% probability this mean about global warming?
Nothing. Absolutely nothing. What this means is that trying to demonstrate global warming by estimating the odds of getting 13 months of temperatures in the top 1/3rd of historic records under the assumption that the climate has not changed is often a stoooopid way of proving or disproving global warming.
Heaven knows, as a method to analyze the temperature data the method I used has flaws all I did was remove one of the obvious flaws in Jeff Masters’s method. But with one less flaw than his method, my estimate of 10% probability this would happen is certainly no worse than the estimate Jeff Masters posted at WunderBlog.
For those wondering if I have a swag of how likely this event would be if climate change had not happened: it’s 1.4%. That’s just a swag based on detrending and then computing R. But, using that value, assuming a lifetime of approximately 70 years, one would expect to see this sort of excursion heat wave happen even without climate change. As it happens, I think the planet has warmed. But someone is going to have to do a lot better than Jeff Masters to turn this heat wave by itself into proof the climate has warmed.
Update: I googled to read who’d blogged. Michael Tobis commented:
Actually that’s bad form from both Masters and NCDC.1.6 million (more precisely, 1,594,323) to one is just the thirteenth power of 1/3, which overstates the case to the extent that successive monthly anomalies are correlated. (Also the 1/3 is somewhat arbitrary and could be a cherry pick, but leave that aside). I don’t doubt that something very odd is going on but the number represents a common elementary statistical error and is in this case excessively alarmist.
Is this the first time MT and I have agreed on something? ![]()
Update Wow! I didn’t realize the US temperatures had such low serial auto-correlation! I obtained data for the lower 48 states here.
Based on this, the lag 1 autocorrelation is R=.150, which is much lower than R=0.936. So ‘white noise’ isn’t such a bad model. I am getting a probability less than 1 in 100,000. I have to run the script longer to get the correct value!
By Joseph D’Aleo, Weatherbell.com
We are heading back to the 1950s in our climate and weather. With a positive AMO (last month +0.90 STD) and a negative PDO (last month -1.26 STD), we are most like the early to middle 1950s and late 1950s to early 1960s. Notice how we were in this mode after the super El Nino of 1998 for several years before the strong El Nino fo 2002/03 and the strong second solar max reverted us back to a positive PDO. After 2007, the PDO has settled into the cold Pacific and warm Atlantic mode.
Some believe the warm Atlantic mode actually began in the late 1980s which may have helped Hugo in 1989 before Pinatubo and Cerro Hudson in 1991 like El Chichon in 1982 may have cooled the Atlantic like it cooled the globe. The Atlantic returned warm in 1995. Dr Bill Gray has shown the warm AMO favors more Atlantic Basin storms and increased landfalls. East coast landfalls are more likely when the Pacific is cold (Irene last year). Weatherbell’s Joe Bastardi predicted overall activity would be down this year though above the normal with slightly cooler tropics and El Nino but that storms would tend to develop close to the mainland (as 3 of the first 4 did). We also believe the east coast is again vulnerable as it was in the 1950s.
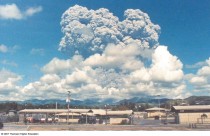
El Chichon 1982 above and Pinatubo 1991 below
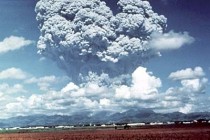
Note how much blockage of solar radiation occurred at Mauna Loa from these major eruptions. That cooled the land and the oceans (most notably the Atlantic). The volcano enhanced El Ninos (weakened Hadley circulation and weakened easterlies allowing warm water from the western tropical Pacific to come east) kept the PDO positive.

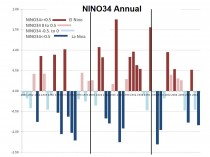
You can see how the La Ninas are favored in the cold modes and El Ninos in the warm mode. This is annual NINO34. We usually see ENSO peak in the October to February time frame. See how after the 2002 El Nino and second solar max, the PDO popped positive then gradually faded in the first graph above and how NINO34 behavior followed suit.
Is there evidence for the 60 year cycle elsewhere in climate and nature? Most defintely as nicely shown in more detail here by Alan Cheetham.
(1) AMO (approximately 62 years) as seen in the first graph
(2) PDO (approximately 60 years) as seen in the first graph
(3) Global temperatures (60 years)
See how the warming from 1888 to 1940 parallelled the 1950 to 2000 warming
The following figure is from a study by Basil Copeland and Anthony Watts, showing a Morelet wavelet analysis of the HadCRUT3 global temperature anomalies [link] The ~62-year cycle is clearly visible.
(4) Southwest drought (64 years)

We are heading to a phase where southwest drought is more likely (consistent with a warm AMO and cold PDO with more and stronger La Ninas).
(5) Atmospheric Circulation Index (zonal versus merdional) (60 years)
We were more zonal than normal a decade or so ago and this helped make AO+ and produce less extremes by producing more variability. Now we are heading down into very meridional territory like the 1950s and 1960s and 1970s when extremes were common, when major troughs and ridges dominated and tended to persist produce great extremes.
(6) ENSO state frequency (60 years)
Here as shown we are back in a La Nina favored mode due to -PDO. We get more frequent, often multi-year La Ninas and briefer El Ninos.
(7) Thermohaline circulation (60 years)
We are in a strong phase favoring +AMO.
(8) ITCZ strength and location (60 years)
(9) Length of Day (LOD) which may influence climate and FAO reports correlates well with fish catches. Ties well with ACI in 5 above
What is behind a 60 cycle? You probably would not be surprised it is the sun/solar system.
Nicola Scafetta has identified the change in the location of the center of mass of the solar system (CMSS) as a possible mechanism driving the 60-year cycle. (Scafetta, N., Empirical evidence for a celestial origin of the climate oscillations and its implications, Journal of Atmospheric and Solar’Terrestrial Physics (2010)
Scafetta shows the following figures described as: ([A- (top)) Rescaled SCMSS 60 year cycle (black curve) against the global surface temperature record (grey) detrended of its quadratic fit; (B- (botttom)) Eight year moving average of the global temperature detrended of its quadratic fit and plotted against itself shifted by 61.5 years. Note the perfect correspondence between the 1880-1940 and 1940-2000 periods. Also a smaller cycle, whose peaks are indicated by the letter “Y”, is clearly visible in the two records. This smaller cycle is mostly related to the 30-year modulation of the temperature. These results reveal the natural origin of a large 60-year modulation in the temperature records.” (SCMSS Speed of the CMSS)


Enlarged
So in summary what can we expect for the next say 10 years?
(1)Temperatures globally which stopped rising in 1997 will begin accelerating down
(2) More meridional patterns and reduced variability which translate into more extremes - warm and cold, floods and droughts
(3) More southwest, southern and central drought and global droughts and floods
(4) More La Ninas - stronger and longer lasting. Briefer, weaker El Ninos
(5) More hurricanes and landfalls in the Atlantic
(6) More La Nina impacts including hurricanes, tornadoes, floods, winter snows north (south and east in the occasional El Ninos)
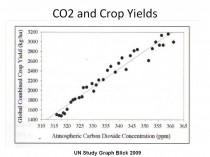
All of this will of course be attributed to CO2 even though CO2 doesn’t correlate with the changes shown and is a beneficial gas that increases crop yields .
This year yields will drop dramatically for the third straight year, this yyear with tens of billions of dollars in crop losses likely. In 1988, the last major drought, losses were over $80B (2008S). Yields can be reduced by droughts and as in 1993 by massive floods). This ties into the ACI above. When the patterns are very meridional they are subject to persistence and extremes. That was the reason for the 1910s, 1930s and 1950s droughts. and the 1988 drought. See much more on similarities to 1988 and 1911 in posts on Weatherbell.com this week.
US climate annual temperature have fallen in 67 years and risen in only 44 years since 1895 while CO2 has risen, not a very convincing driver.
We are told, natural variability has been ruled out. It seems to me they never seriously looked. These are the same folks (including Mann and Schmidt) who this week admitted they didn’t the difference between a derecho and the Geico gecko.
By Dave Burton, Burtonsys.com
Climate Movement activists are pushing scientifically ungrounded policies, which would have severe economic consequences for North Carolina. This bill represents “push-back,” to force policymakers to conform policy to what the science really tells us about sea level rise.
Mankind has been driving up CO2 levels substantially for about 3/4 century. We’ve raised average outdoor CO2 levels from about 300 ppm to nearly 400 ppm. (Indoor levels are often several times that.) But over that time period, the rate of sea level rise hasn’t increased at all.
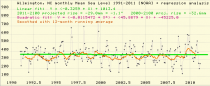
NC’s best tide gauge is the GLOSS-LTT gauge at Wilmington, which has been measuring sea level continuously since 1935. Over it’s full history, the rate of sea level rise at Wilmington has averaged a glacially slow 2 mm/year (about 8 inches per century).
Here’s NOAA’s graph of the full Wilmington sea level record, juxtaposed with a graph of CO2 level:
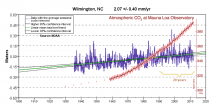
Enlarged
CO2 levels are in red, and sea level is in purple. If CO2 were driving sea level rise, then the purple graph would curve upward at the right-hand end, like the CO2 graph. (Click on the graph for a larger version.)
But over the last 20 years, sea level hasn’t gone up at all at Wilmington. That’s right: sea level rise at Wilmington, averaged over the past 20 years, is zero:
There are hundreds of high-quality tide gauge records around the world measuring sea level. Because the crust of the Earth is constantly moving, these tide gauges show widely varying rates of sea level change. At some locations, sea level is rising, at others it is falling, but the average is a very slight increase of between 1 and 2 mm/year. (The geographically-weighted average of the sea level trends at 159 NOAA-selected GLOSS-LTT gauges is +1.1 mm/year.)
Most of these tide stations show no evidence of any acceleration (increase) in the rate of sea level rise over the last 3/4 century. Some (like Wilmington) show slight decreases, others show slight increases, but the best studies indicate that there has been no increase in the average rate of sea level rise around the world, and most of the best studies show a slight decrease.
In other words, all that additional CO2 in the atmosphere hasn’t increased the rate of sea level rise at all.
We also have 19 years of satellite altimeter measurements of sea level over the open ocean. That’s too short to draw definite conclusions, and there are major problems with the quality of the satellite data, but it is nevertheless worth noting that, like the tide gauge measurements, the satellites seem to show that as CO2 levels go up, the rate of sea level rise is decreasing, rather than increasing:
Enlarged
For years, Climate Movement alarmists have been predicting that, as a result of what MIT climatologist Richard Lindzen calls “gross exaggerations of highly uncertain computer projections combined into implausible chains of inference,” higher atmospheric CO2 levels should cause the rate of sea level rise to increase dramatically. But the data contradicts that prediction.
We’ve done the experiment and we know the result. When mankind began driving up atmospheric CO2 levels (with dramatically beneficial effects on agriculture) the post-LIA acceleration in rate of sea level rise ceased. The last ~3/4 century of increasing CO2 levels and emissions have caused no increase at all in the rate of sea level rise. It is irrational and unscientific to expect that repeating that experiment over the next 3/4 century will have a significantly different result. The best prediction for sea level in the future is simply a linear projection of sea level in the past. For the southern NC coast, that’s a measly 7 inches of sea level rise by 2100 (and a little over twice that for the northern NC coast, due to land subsidence there).
Regulatory rulemakers create a type of “law” which impacts citizens just as much as bills passed by the Legislature, but often with considerably less direct citizen input than is possible when laws are enacted by legislators who must stand for election every two years. There’s real danger that rulemakers, under pressure from special interest groups, will subordinate geophysical science to political science, codifying scientific nonsense into North Carolina’s body of rules and regulations.
Nobody should want that! This year, the DENR is dominated by Democrats and the NCGA by Republicans. But in a few years it might be the other way around! I think that the rulemakers should conform NC’s rules regarding land development, setbacks, structure elevation, insurance, etc., to actual scientific evidence, rather than to the political winds of the day. Don’t you?
I recently wrote an article about sea level for J. Natural Hazards. The topic was NY sea levels rather than NC sea levels, but, just as a rising tide lifts all boats, non-accelerating sea level rise in NY is non-accelerating sea level rise in NC: doi:10.1007/s11069-012-0159-8
By the way, do you know how long a sea level record needs to be to establish a robust trend? About 60 years; 50 at the very least! That’s what the research tells us. See:
Douglas, B. (1995). Global sea level change: Determination and interpretation. Reviews of Geophysics 33(S1): doi:10.1029/95RG00355. issn: 8755-1209.
Jevrejeva, S., J. C. Moore, A. Grinsted, and P. L. Woodworth (2008), Recent global sea level acceleration started over 200 years ago?, Geophys. Res. Lett., 35, L08715, doi:10.1029/2008GL033611 (and here).
Believe it or not, even the deeply flawed 2010 CRC Science Panel report admitted (p.6) that, “tide gauges [which] don’t extend back in time more than 50 years [make] it difficult to resolve changes in the rate of rise over the decades” (though they then went on to use a 24 year record in preference to an available 75 year record)
Dr. Nicola Scafetta (Duke U.) made this point (in private communication): “...an interval of just 30 years is the worst that can be chosen because it is half 60-year cycle, and it happened that for SLR the period 1975-2005 had this 60-year cycle during its warming phase (the temperature warming phase was about 1970-2000). So, if you fit the last 30-40 years you get an overestimation of the real trend.”
Yet the CRC Science Panel’s 2010 Report (which recommended a 39 inch SLR projection) used just 24 years of data from a tide gauge at Duck, NC that is severely affected by land subsidence, even through there was an excellent 75 year record available for Wilmington, the only GLOSS-LTT tide gauge in NC. That was just one of the errors in their Report, and not the worst one, unfortunately.
Dave Burton
member, NC Sea Level Rise Impact Study Advisory Committee
IPCC AR5 WG1 Expert Reviewer
NC-20 Science Advisor
See also the two Bob Tisdale posts on WUWT on this issue here and here. See this on Icecap for more on the North Carolina sea level issue. When realists and the legislature tried to inject reality based on real data, the alarmists and enviros revolted and fast tracked junk model based science pal review papers to try and win the case, one of their favorite tricks.
By P Gosselin, NoTricksZone on 29. June 2012

Dr. Wolfgand Thune
As the science of warmists gets exposed as woefully inadequate, slipshod and flawed, all they can do now is give each other awards in pompous ceremonies in an effort to generate a (fake) sense of achievement and contribution. They’ve been reduced to a pretend world.
One example is the Technical University of Berlin recently awarding Prof. Hans Joachim Schellnhuber an honorary doctorate. Schellnhuber is Director of the infamously uber-alarmist Potsdam Institute for Climate Impact Research (PIK) and is chairman of the WBGU Advisory Council.
Last year Schellnhuber and his WBGU published a “masterplan” calling for the dilution of democracy worldwide and forcing societies to take up a highly restricted “sustainable path” that would keep the planet from reaching his nine mathematically concocted “dangerous tipping points”. In it he advocates indoctrination and “changes in awareness”.
Schellnhuber even once publicly stated that 1 billion people would be the ideal human population for the planet, which would be like eliminating all the worlds people except China and letting them have it all to themselves.
Schellnhuber, however, having clearly drifted from science to radical policy formulation and advising, is coming under increasing fire from number of scientists and critics.
For example, Dr. Wolfgang Thune, a retired German meteorologist and member of the European Institute for Climate and Energy (EIKE) commented yesterday on Schellnhuber’s honorary doctorate:
That Professor Dr. Hans-Joachim Schellnhuber, the inventer of the “tipping elements”, is now being celebrated and awarded an honorary doctorate is amazing. But what’s even more amazing is that he received this from the TU Berlin for his outstanding scientific achievements in the fields of climate impact research and policy counselling’. Did the TU Berlin, in its addiction to political attention, even stop to consider just how much it is damaging its excellent reputation among the professional world?
The climate science by Schellnhuber & Co. is pure voodoo-magic spreading fear among the public and reaching big time into the pockets of taxpayers.
The Potsdam Institute for Climate Impact Research (PIK) is senselessly wasting the money of taxpayers. ‘Climate protection’ is a scientific swindle because the weather is not something that can be protected.”
Thune even demands that the PIK be shut down immediately.
“That would be a small but effective step in preventing the national debt from getting out of control.”
Dr. Wolfgang Thune is a certified meteorologist, who for years was a meteorology expert for ZDF television, and has written about the falsifiications and fraud surrounding the UN IPCC. He is the author of numerous books. His latest work is: Prophets in the Struggle for the Climate Throne.
The latest German skeptic book exposing junk climate science and shady climate politics.

By Paul Dreissen
The Future We Want outlined a “common vision” for planetary “sustainable development,” as proclaimed by the “Organizing Partners of the Major Group of NGOs,” to guide the taxpayer-funded Rio+20 summit that ended last week in disarray and acrimony.
The activist organizations that cobbled the document together filled it with hundreds of platitudes and pseudo-solutions to global warming cataclysms, newly reconstituted as threats to resource depletion and biodiversity - and presented as standards and mandates for countries, communities and corporations.
The terms “sustainable development,” “sustainable” and “sustainability” appeared in the original text an astounding 390 times. Like “abracadabra,” these nebulous concepts were supposed to transform the world into a Garden of Eden global community, under United Nations auspices, that will use less, pollute less, and save species and planet from their worst enemy: humans.
To glean the document essence, however, readers only needed to understand two concepts: control and money - to impose the future the activists wanted.
The NGOs and UN called for “donations” from formerly rich European Union and Annex II (Kyoto Protocol) countries, at 0.7% of their gross national product per year. With the combined GNP of the contributing nations totaling about $45 trillion in 2010, the transfers would total $315 billion per year, or $3.2 trillion per decade.
President Obama and Secretary of State Clinton had previously committed the United States to provide $105 billion annually, based on our $15 trillion GNP (and strained line of credit). With US per capita GNP pegged at $47,340 - each American family of four would pay $1,325 a year. That may seem like chump change compared to TARP, Obamacare or the Obama Stimulus. But over a decade US citizens would involuntarily shell out well over a trillion dollars to UN sustainability schemes.
The UN claims it has already received more than $500 billion in pledges from governments and companies, to reduce fossil fuel use, increase renewable energy generation in poor countries, promote bicycle use in Holland, teach sustainability in universities, conserve water - and somehow still reduce global poverty. Time will tell how many are worth the paper they were printed on.
To oversee this unprecedented wealth transfer to UN bureaucrats and NGO activists, The Future We Want architects sought to establish “an intergovernmental process” to assess financial needs, consider the effectiveness, consistency and “synergies” of existing instruments and frameworks, evaluate additional initiatives, and prepare reports on financing strategies. This grand scheme would be implemented by an intergovernmental committee of 30 “experts,” who will be accountable to - no one, actually, except perhaps the Secretary General of the esteemed United Nations.
The document reassured readers that “aid architecture has significantly changed in the current decade,” and “fighting corruption and illicit financial flows [has become] a priority.” Diogenes would search in vain for evidence of this.
Indeed, the very idea of still more aid must be questioned. “Has more than US$1 trillion in development assistance over the last several decades made African people better off?” Zambia-born economist Dambisa Moyo asks in her book, Dead Aid. “No,” she answers emphatically. What’s needed are investment, development, less regulatory red tape, and an unleashing of entrepreneurial instincts.
Nevertheless, the UN is determined to plow ahead, claiming that somehow, this time, they will get it right. Surely, the prospect of promoting sustainability and saving the planet and its species will convert scurrilous dictators, Western politicians and their cronies into honest leaders who would never divert eco-funding to political friends, Swiss bank accounts or crony-capitalist wind and solar projects.
With Rio de Janeiro’s Christ the Redeemer statue bathed in green light (to symbolize ecology - or was it money?) and the National Religious Partnership for the Environment proselytizing throughout the event, surely miscreants would sin no more.
Meanwhile, Statement 61 (of 283!) helpfully pronounced that “urgent action on unsustainable patterns of production and consumption ... remains fundamental in addressing environmental sustainability”...and each country should “consider the implementation of green economy policies in the context of sustainable development and poverty eradication.”
In essence, the Rio+20 message was, “You got a problem? The UN team has an app for that!”
From poverty eradication to food security, nutrition and “sustainable agriculture,” to water and sanitation, to energy, sustainable tourism and transport, and sustainable cities and “human settlements,” the Future We Want “framework for action and follow-up” had it covered! Of course, there were caveats.
Everyone has a right to safe, sufficient, nutritious food - but biotechnology, chemical fertilizers, insecticides and modern mechanized farming are unsustainable. Electricity is vital, but the 1.4 billion now without lights or refrigeration must be content with “green energy.” Health “is a precondition for, an outcome of, and an indicator of, all three dimensions of sustainable development,” but no DDT allowed.
The authors also promised “full and productive employment, decent work for all, and social protections” for workers, to clean up the oceans, stop illegal mining and fishing, and ensure that only “sustainable forest management” prevails (the cut-no-trees kind that produces uncontrollable wildfires).
The Future We Want also lauded women, the scientific and technological community, indigenous peoples, young people, workers, trade unions, small-scale farmers, NGOs and “civil society” - while placing new burdens on the corporations that will be expected to generate trillions to prop up these efforts.
The document also included multiple proposals for technology transfers - but deleted all references to protecting patents and intellectual property rights. It also excised language “respecting the right to freedom of association and assembly, in accordance with our obligations under international law.”
Thankfully - despite attendance by 45,000 delegates from 180 nations - the Rio+20 summit became just another gabfest, the mandates became even more ill-defined “goals” and “recommendations,” and the world dodged another Kyoto-style bullet.
The activists and bureaucrats will doubtless be back, in a couple more years, in an exotic new locale, with new plans for saving the planet from scary new catastrophes.
However, poor countries are slowly catching on that these UN events are little more than neo-colonialist, eco-imperialist schemes to control and restrict economic development - and poor families are beginning to realize they won’t get a dime from these sustainability pledges or derive any tangible benefits from the green schemes.
Met Office Computer Models Are Complete Rubbish
Met Office 3-month Outlook, 23 March 2012: “The forecast for average UK rainfall slightly favours drier-than-average conditions for April-May-June as a whole, and also slightly favours April being the driest of the 3 months. With this forecast, the water resources situation in southern, eastern and central England is likely to deteriorate further during the April-May-June period… This forecast is based on information from observations, several numerical models and expert judgement.”
Reality
April: 2012 had wettest April for 100 years, Met Office says “It has been the wettest April in the UK for over 100 years, with some areas seeing three times their usual average, figures from the Met Office show. Some 121.8mm of rain has fallen, beating the previous record of 120.3mm which was set in 2000.”
June: June on course to be wettest in a century: Flooding, storms and persistent showers have blighted the country in recent weeks putting this June in line to become one of the soggiest in 100 years.
25 June: Spring is wettest in Britain for 250 years - England and Wales are on course for the wettest late spring and early summer for 250 years, experts said yesterday. June has just seen its fourth washout weekend and yet more downpours are forecast. Now it is feared combined rainfall for April, May and June will break the record of 13.2in (336mm) set in 1782 and be the highest since records began in 1766.
------------------
Unscientific American on line chat on heat wave to cultists - blames 90s this week on AGW
Note: the sun 3 years and 7 months after the solar minimum.

By using other spectral bands and zooming in very close, the observatories are able to see a few pores or specks that never would have been seen with old technology. Sunspot number yesterday was between 10 and 13 unadjusted. Three days without a sunspot on Layman’s Sunspot site which tracks only spots large enough to have been seen before. We are tracking very close to cycle 5 in the Dalton Minimum.
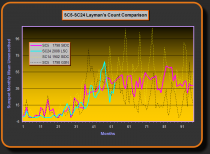
There is a lag of maybe 8 years between solar activity levels and global temperature affects. The sun went very quiet after 2006, which would suggest temperatures will dive in a year or two. The leveling off since 1997 has been due to the change in the PDO to cool. When the sun cooling sets in and the Atlantic cooling begins (5-10 years), the world will be focused on cold and how we can get more fossil fuels to provide heat because the wind farms and solar farms are not meeting the needs. Recall that despite a huge investment in wind in the UK, in the frigid weather of December 2010, the wind provided just 0.6% of the electricity need for the UK and millions were placed needlessly in energy poverty, having to make a decision whether to heat or eat. That is our future if Obama and his green pals continue their rule and the EPA is not controlled.
See Joe Bastardi challenge Jeff Masters of Weather Underground (name says it all) on the role of the sun and oceans on Real Science.
-------------------
By Joseph D’Aleo
Today the once great magazine Scientific American continued to propagate the hoax of global warming by blaming the two day heat wave in the east on greenhouse gases. They held an on line briefing by David Biello, chief propagandist today.
Overview Extreme Weather and Climate Change
Several temperature records were broken along the East Coast on Tuesday, with the mercury reaching into the high 90s at all three New York City airports and parts further north, such as Burlington, Vt., where residents and businesses are ill-prepared for such heat. The heat wave is expected to continue through the end of the work week along the Eastern Seaboard, and severe storms are parked over the Midwest, causing floods in Duluth, Minn.
Hot weather is an often overlooked cause of death worldwide and in the U.S., especially in low-income urban areas where residents might lack air-conditioners. In fact, high heat is the number one weather-related cause of death in the U.S. In an average year, heat kills more people than floods, hurricanes, lightning and tornadoes combined, according to the National Weather Service.
--------------------------
Lets look at the facts.
First of all extreme cold kills twice as many as extreme heat. This will increase in the future if the greens have their way as power brownouts and blackouts and soaring heating oil prices and electricity rates put more and more people into fuel poverty. This will also cause more deaths from the heat waves that are an inevitable part of summer.
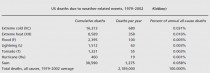
Here is a look at Global Death and Death Rates Due to Extreme Weather Events, 1900-2008. Source: Goklany (2009), based on EM-DAT (2009), McEvedy and Jones (1978), and WRI (2009). Global rates have declined, which is disappointing to the radical population control freaks among the greens.
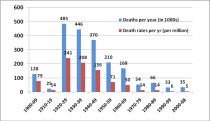
Enlarged
This month in the northeast had been cool without 90 degree days the first 19 days. Boston was averaging 4.7F below normal and Central Park 2.5F below. Cooler than normal weather followed the three day summer heat.
Here is the EPA’s own heat wave Index.
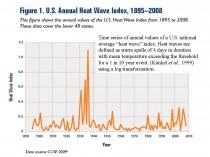
Here is a plot of state all-time record highs by decade.
Temperatures did not reach 100F in NYC or BOS. 100F are not new phenomena. Also there is NO correlation with CO2.
Boston also shows no upward trend.

Here is all 50 states all 12 months the records by decade through the 2000s. Latest occuring record year used.

The 2000s was an unusually benign decade. Last year had some brutal heat in Texas and Oklahoma and yes, this past winter and spring on the rebound from the second strongest La Nina in history and two of the coldest winters it was warm in the lower 48 states (though brutally cold in Eurasia and Alaska.
Even with the heat and drought, the last 117 years shows no trend for Texas in Temperatures and a very slight upward trend for precipitation.
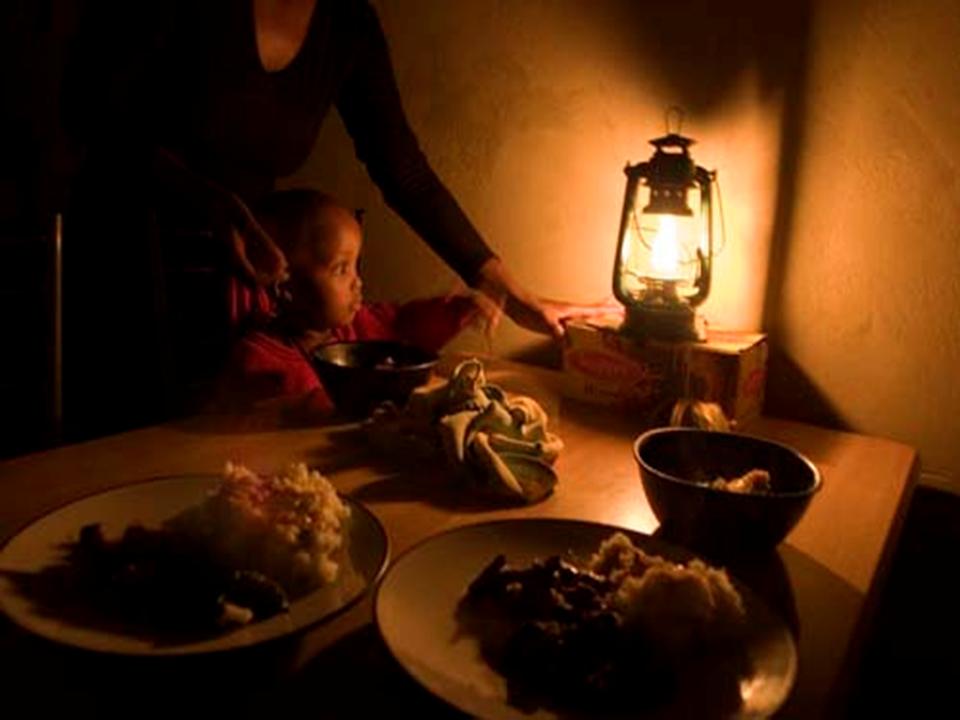
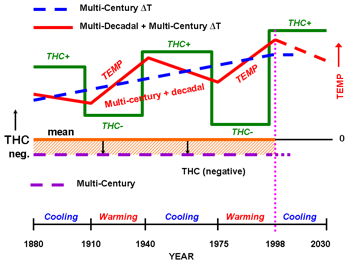
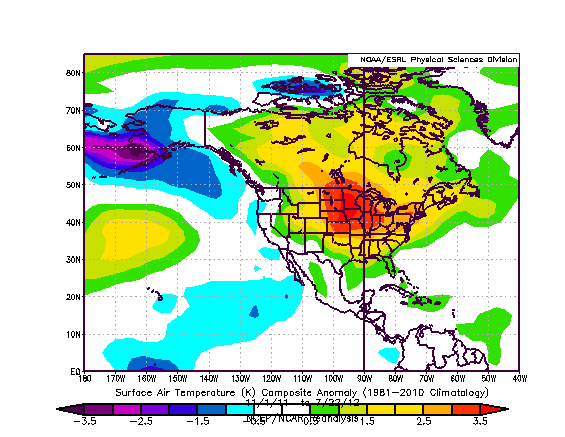
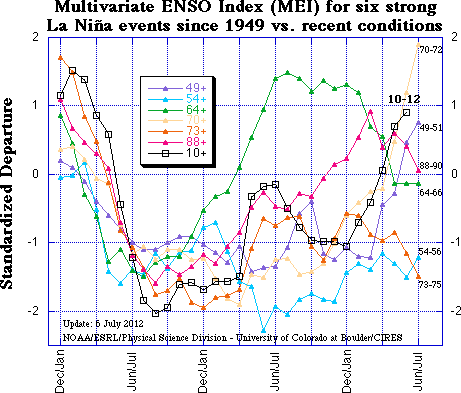
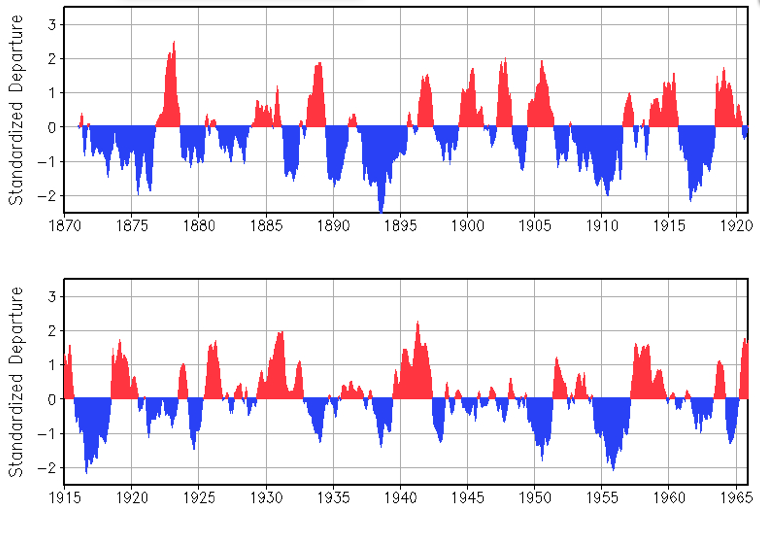
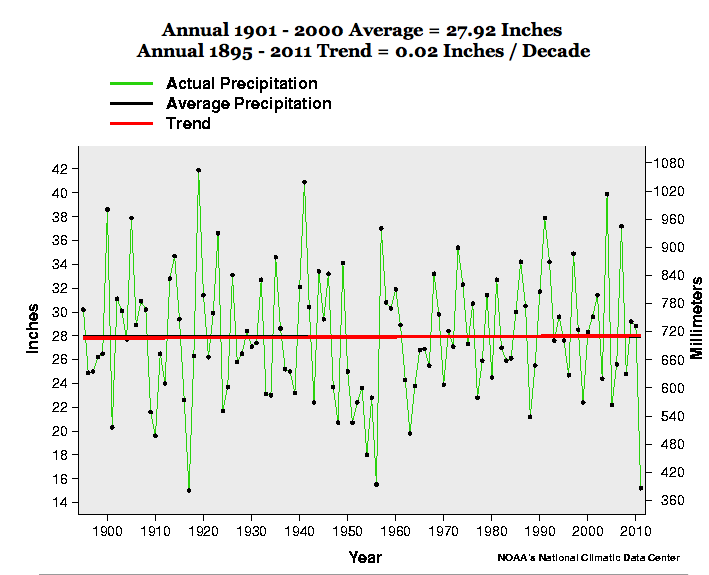
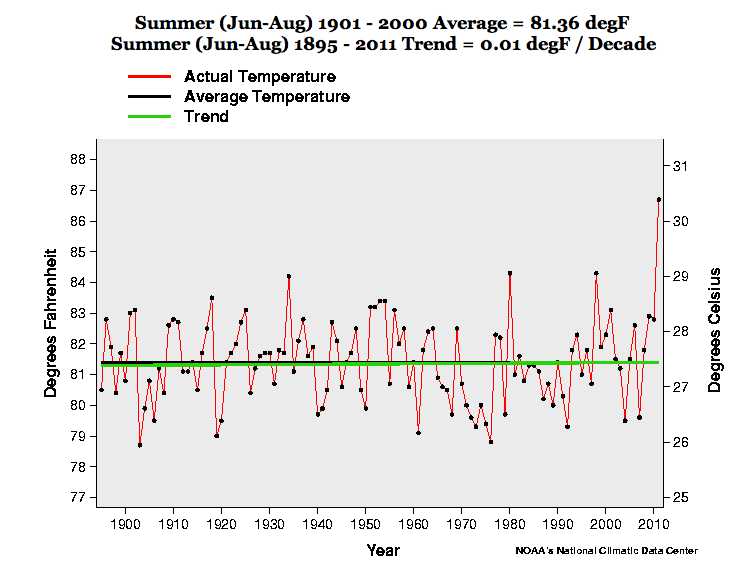
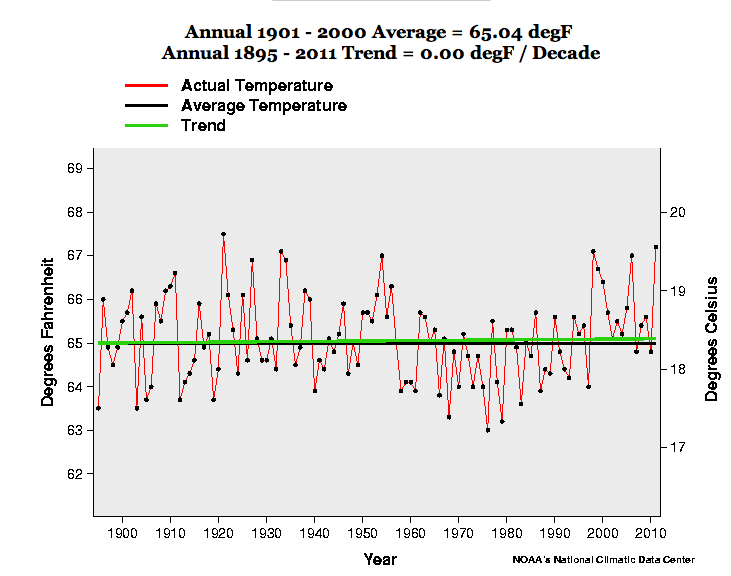
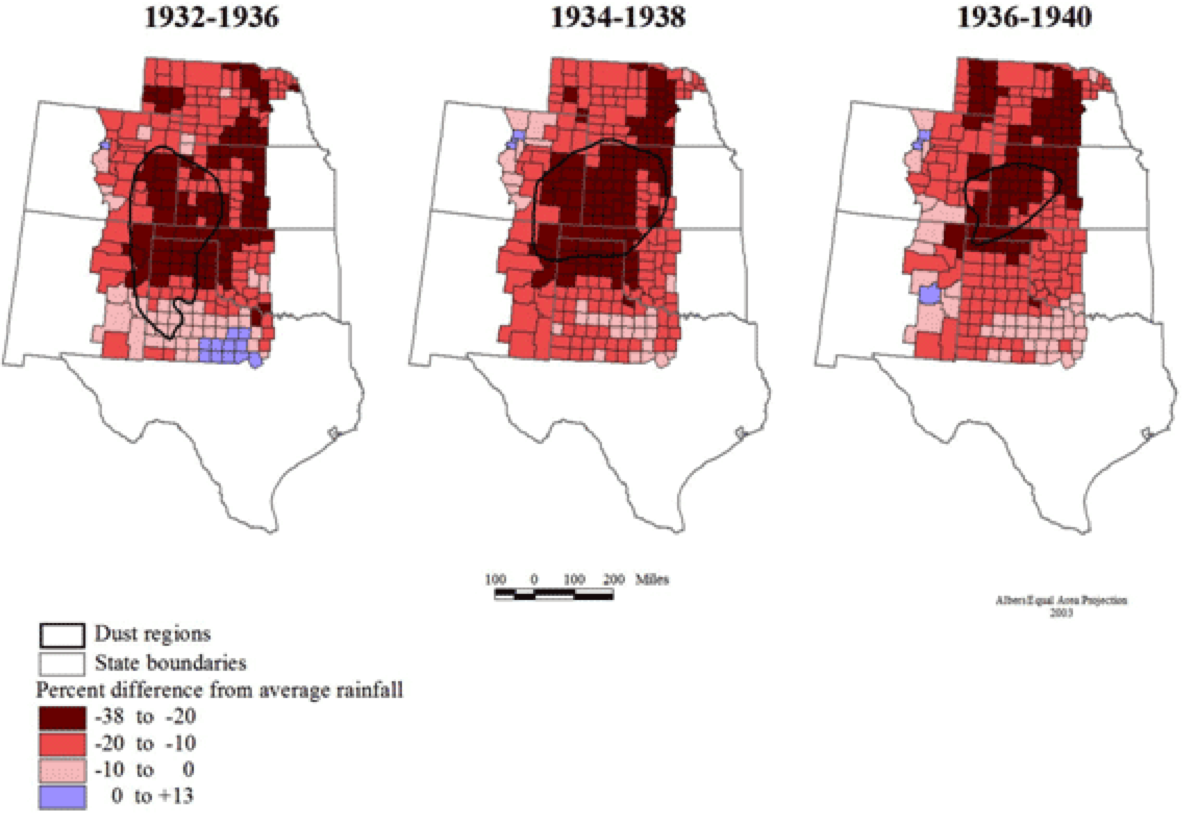
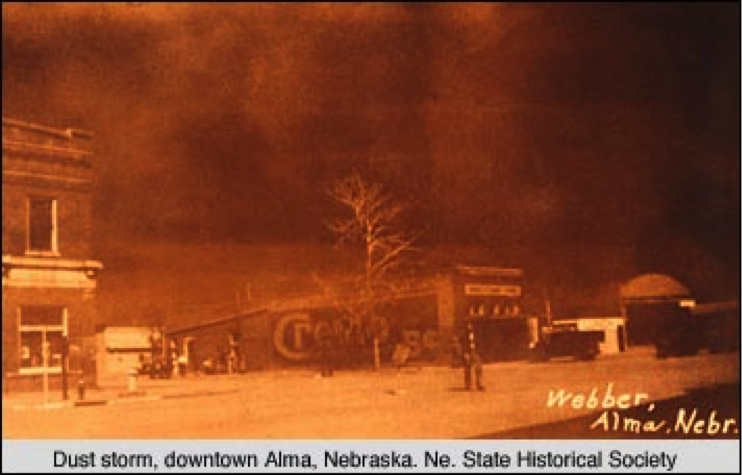
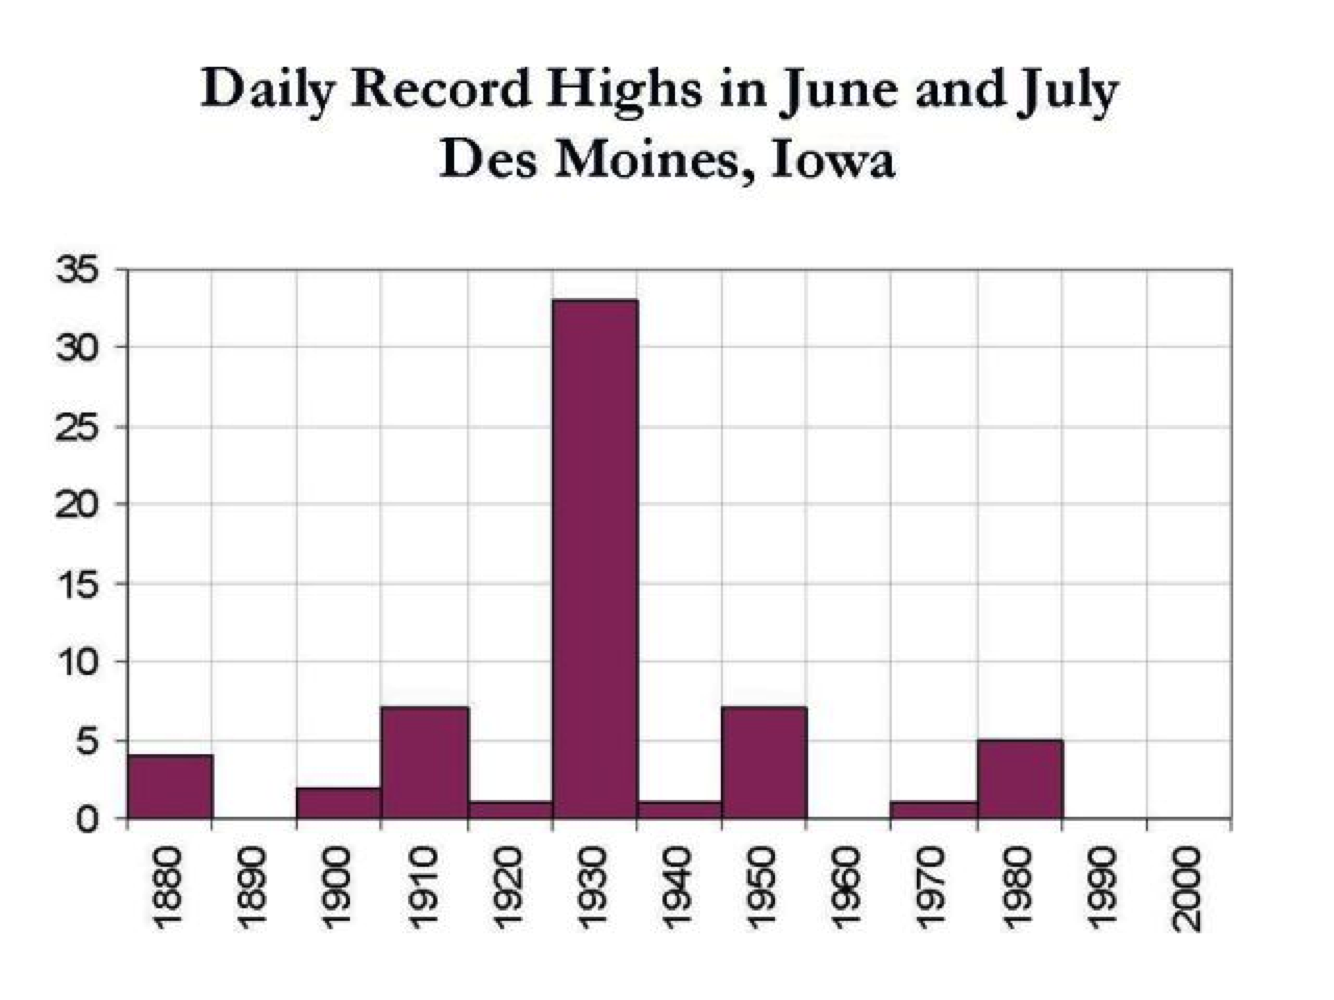
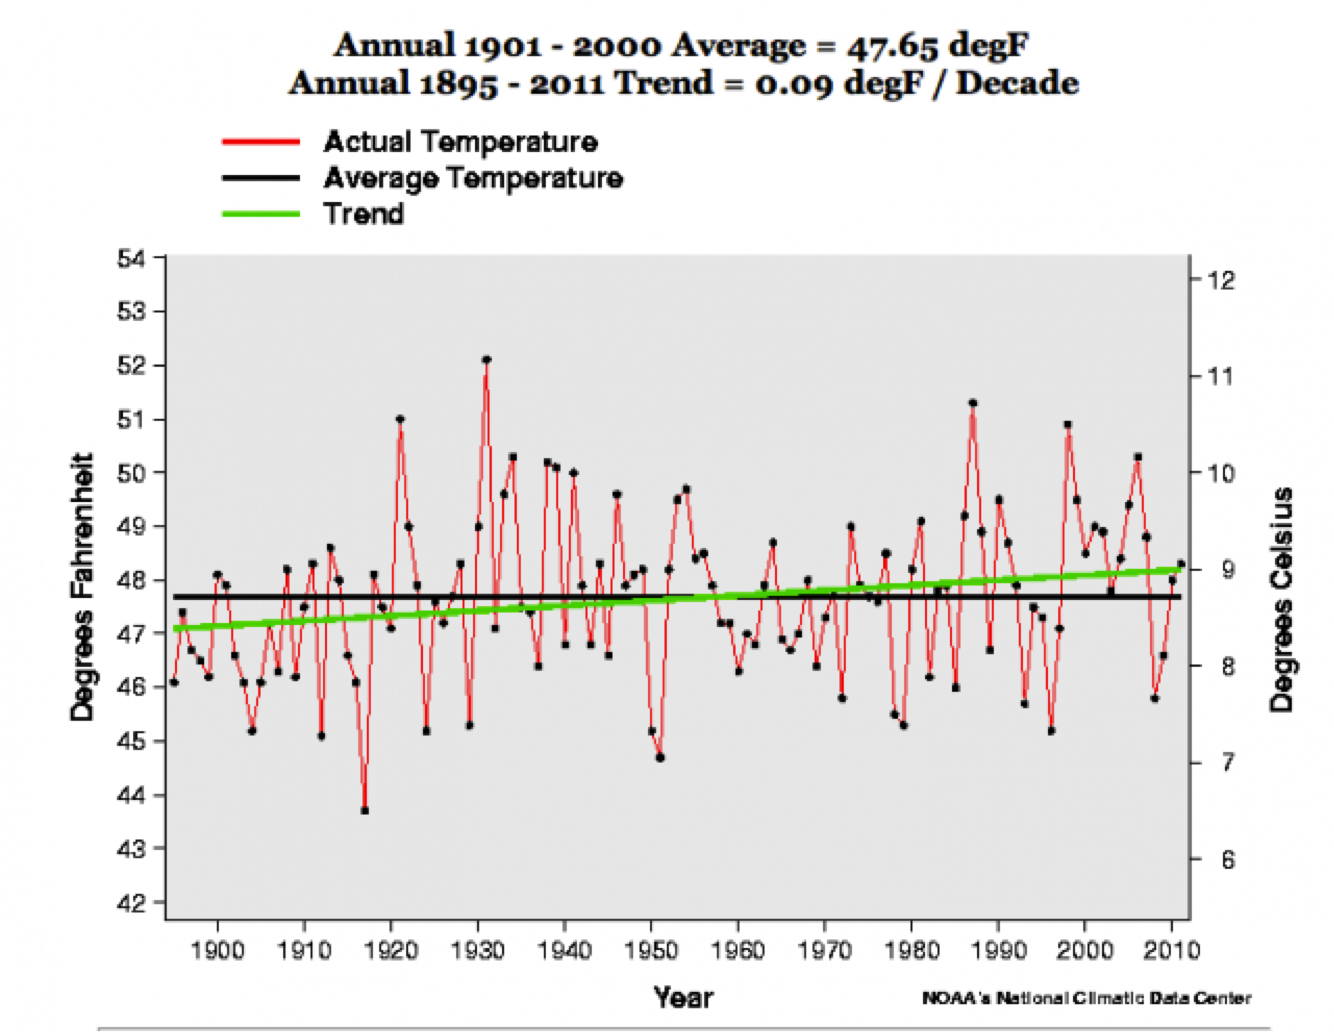
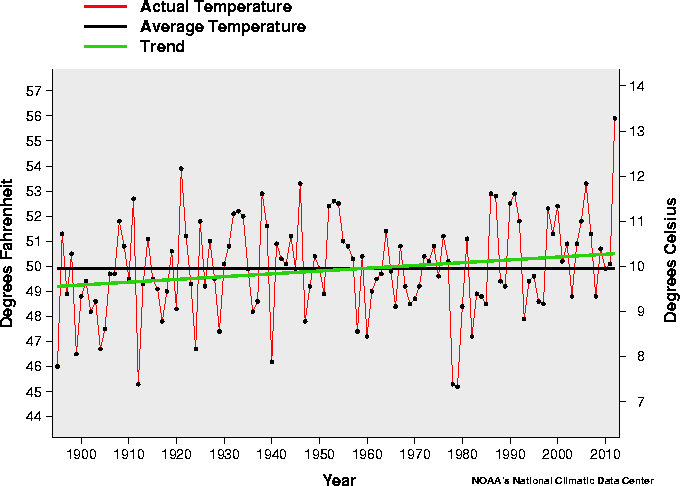
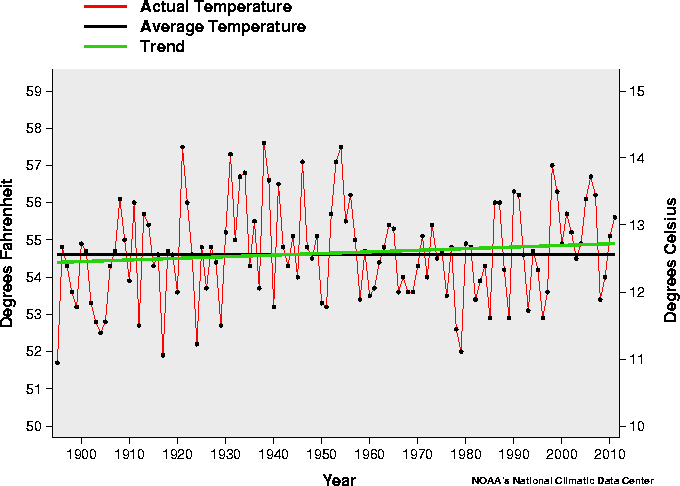
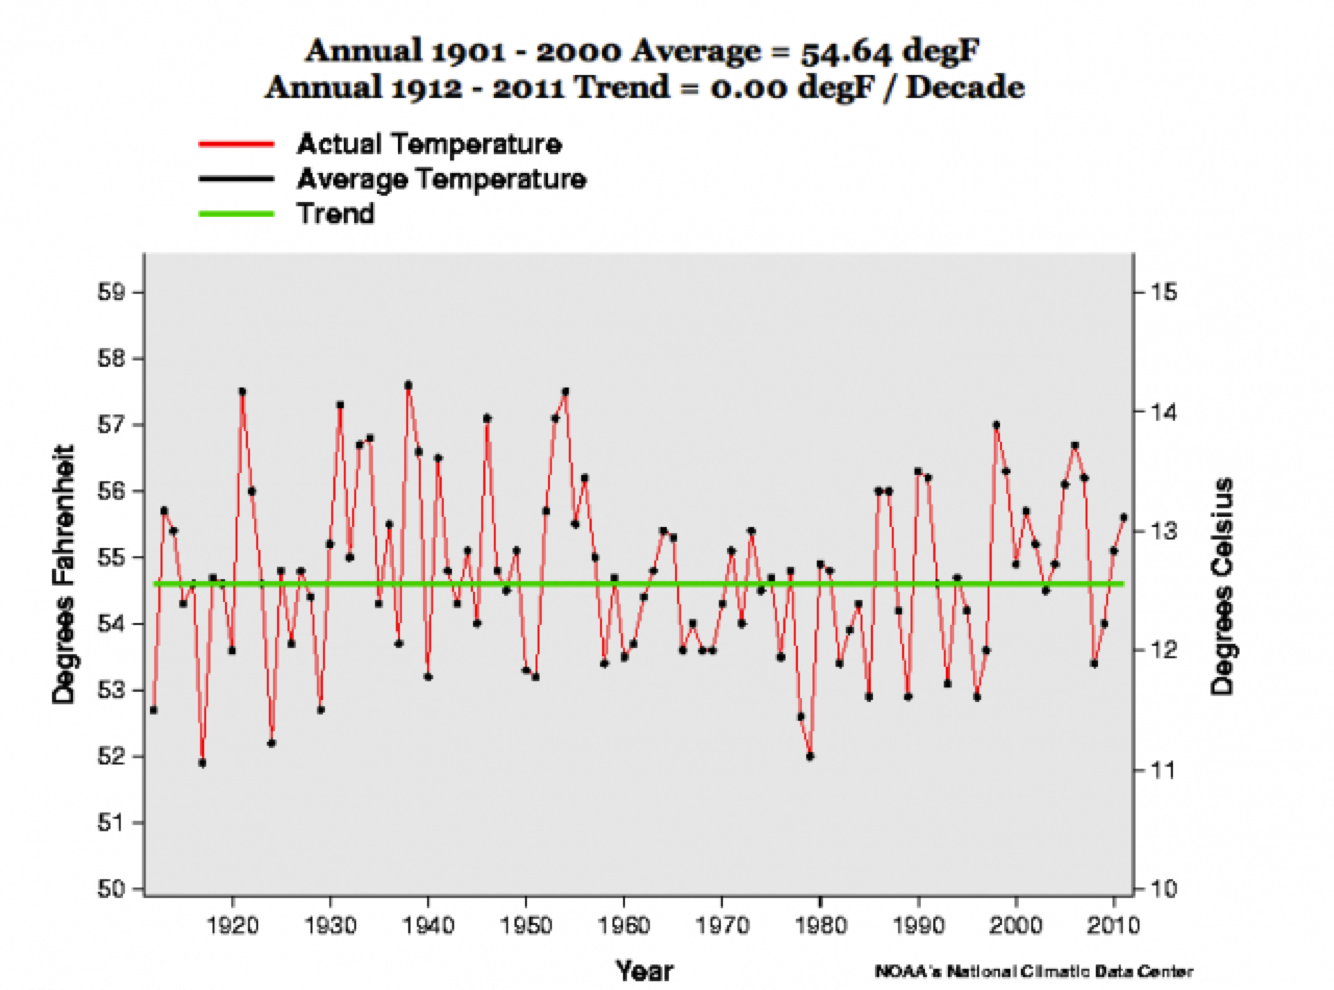
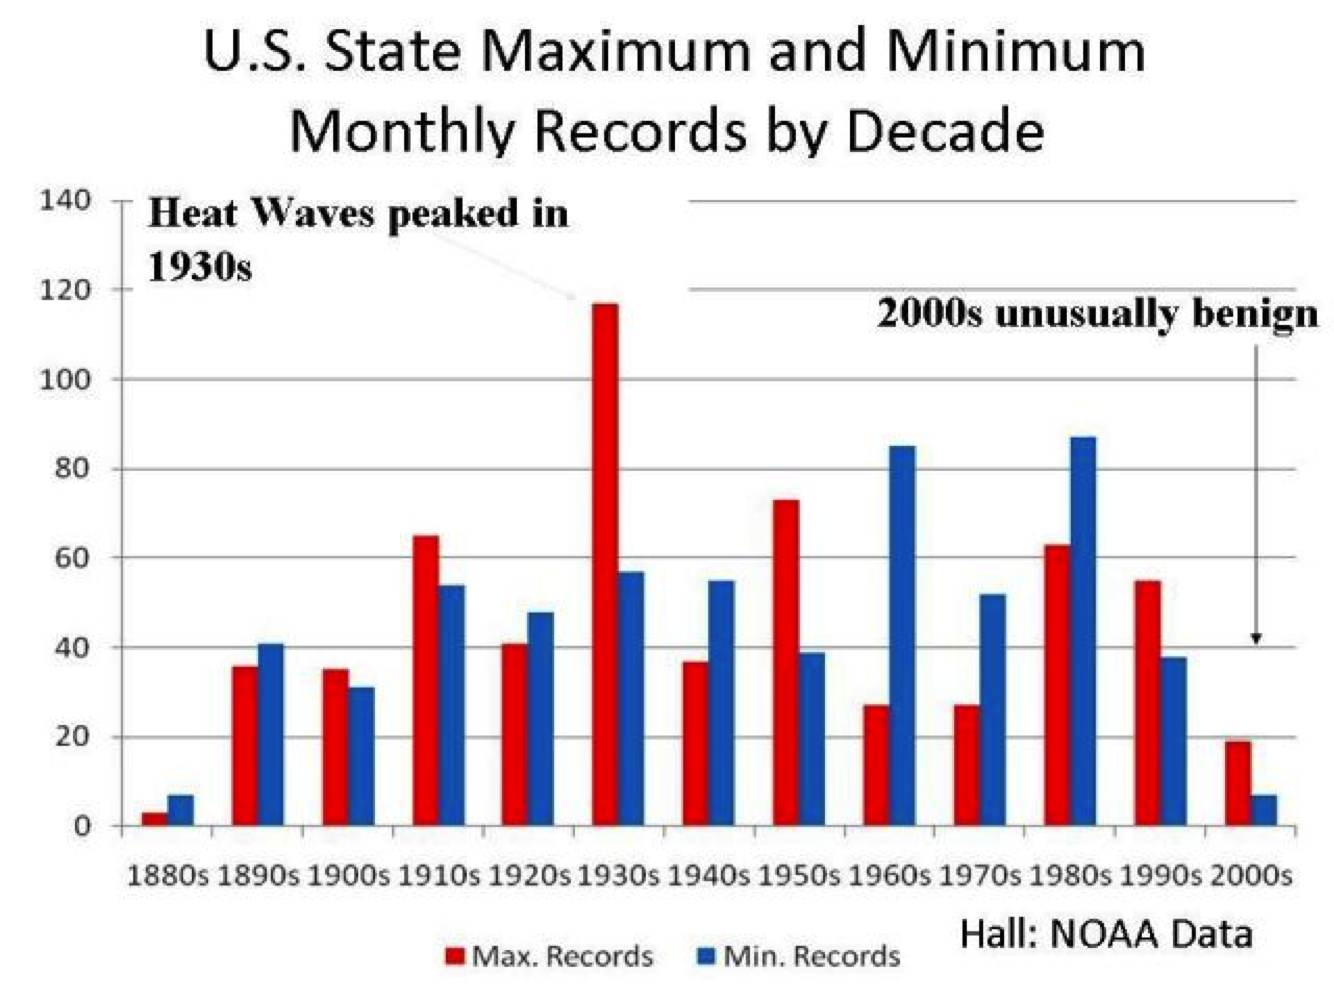
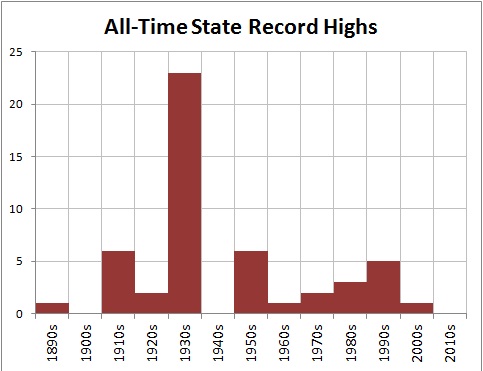
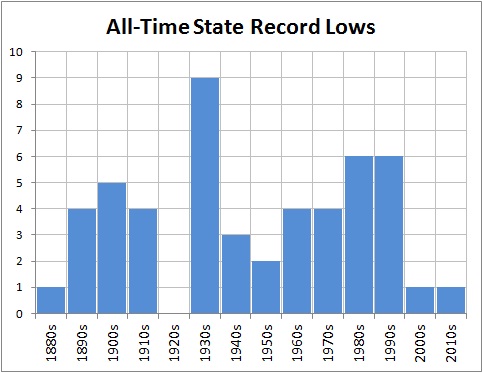
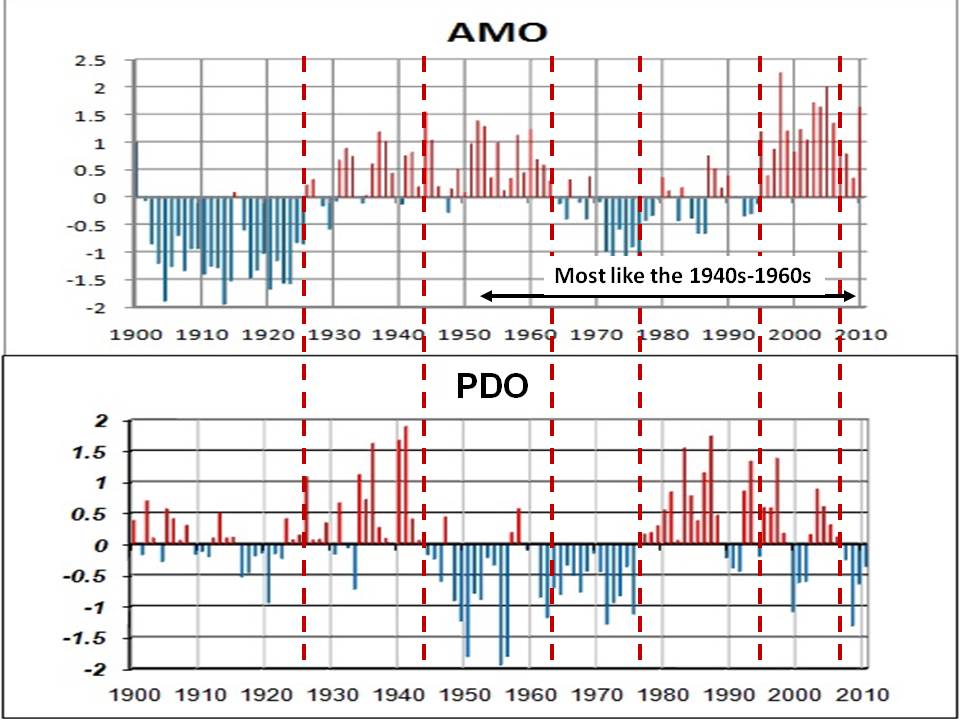
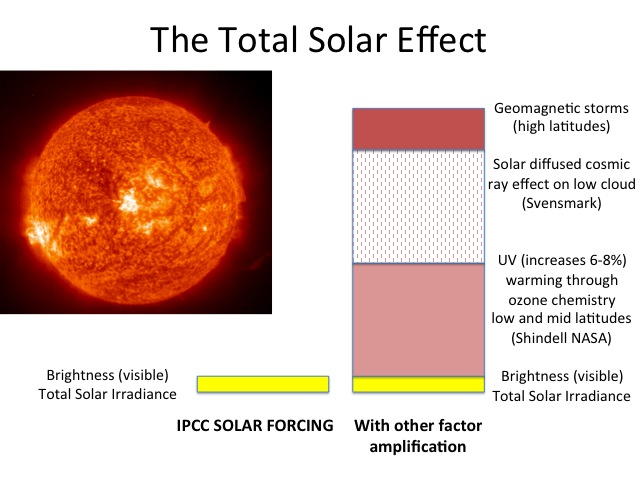
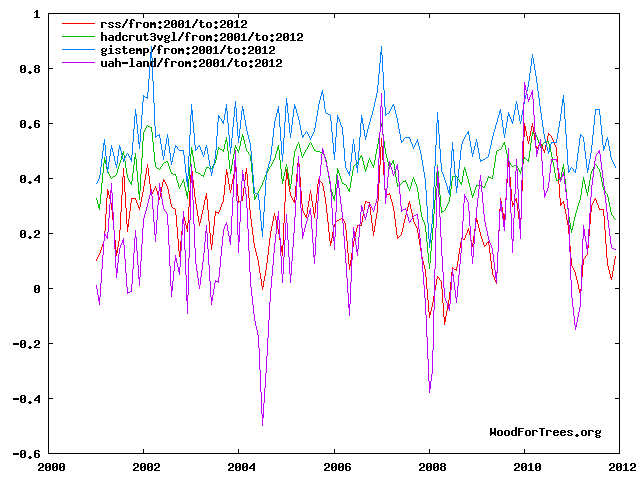
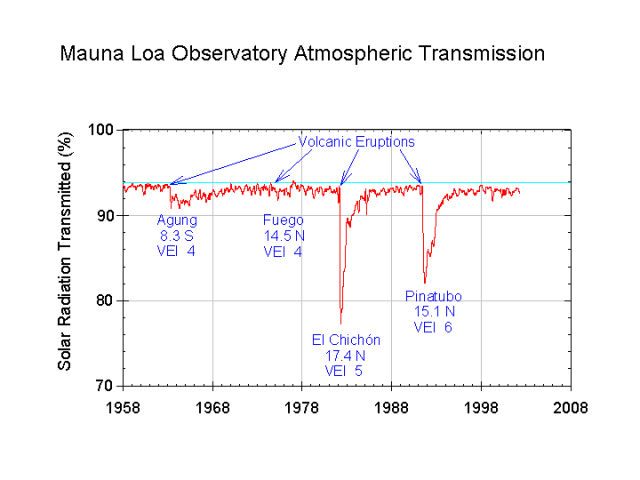
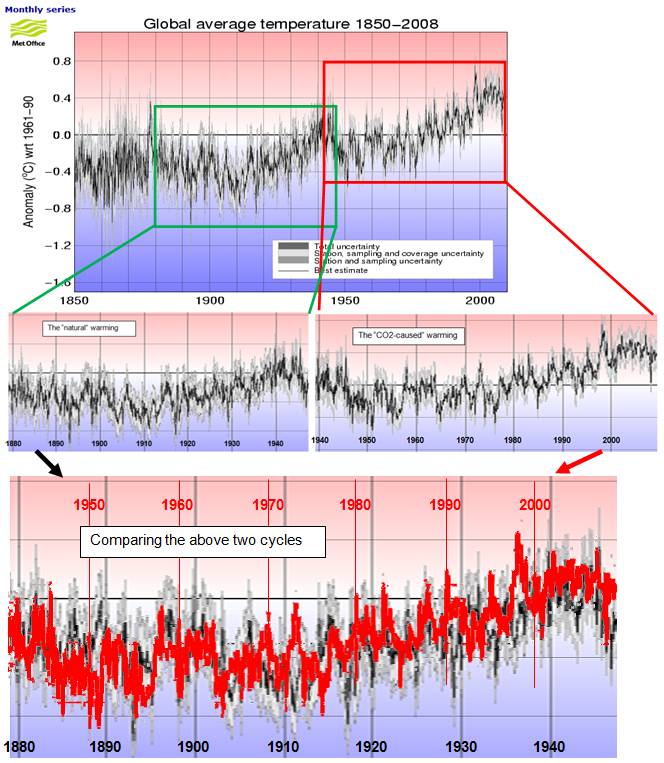
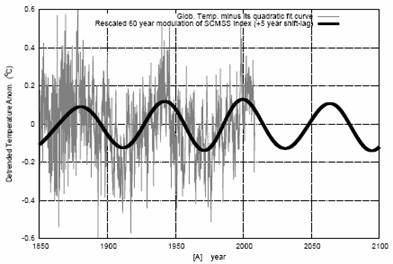
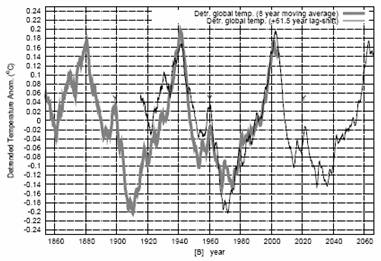
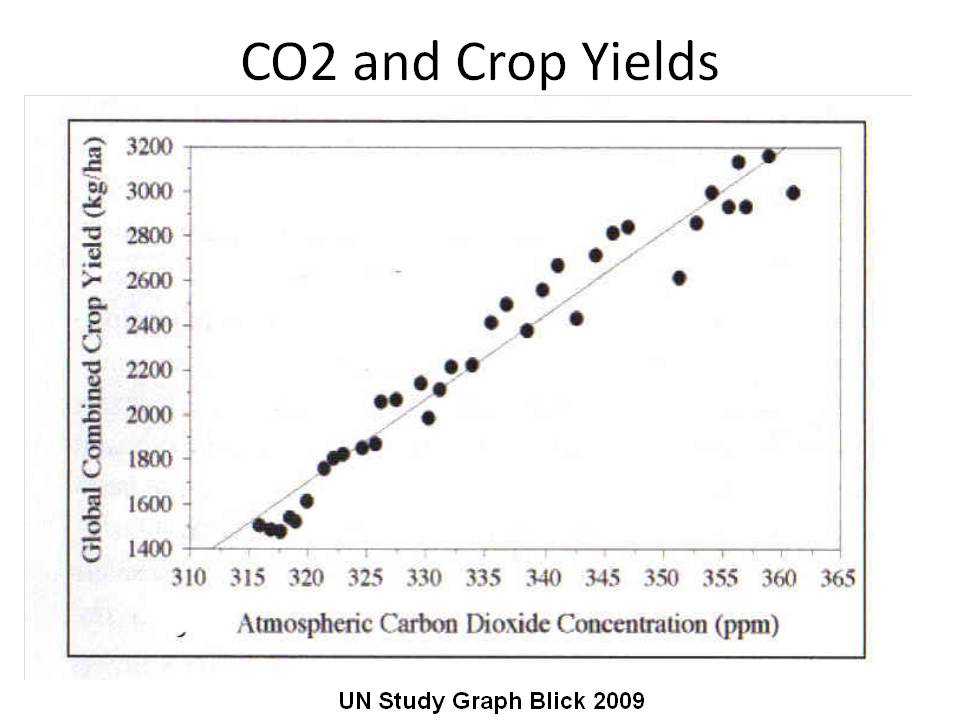
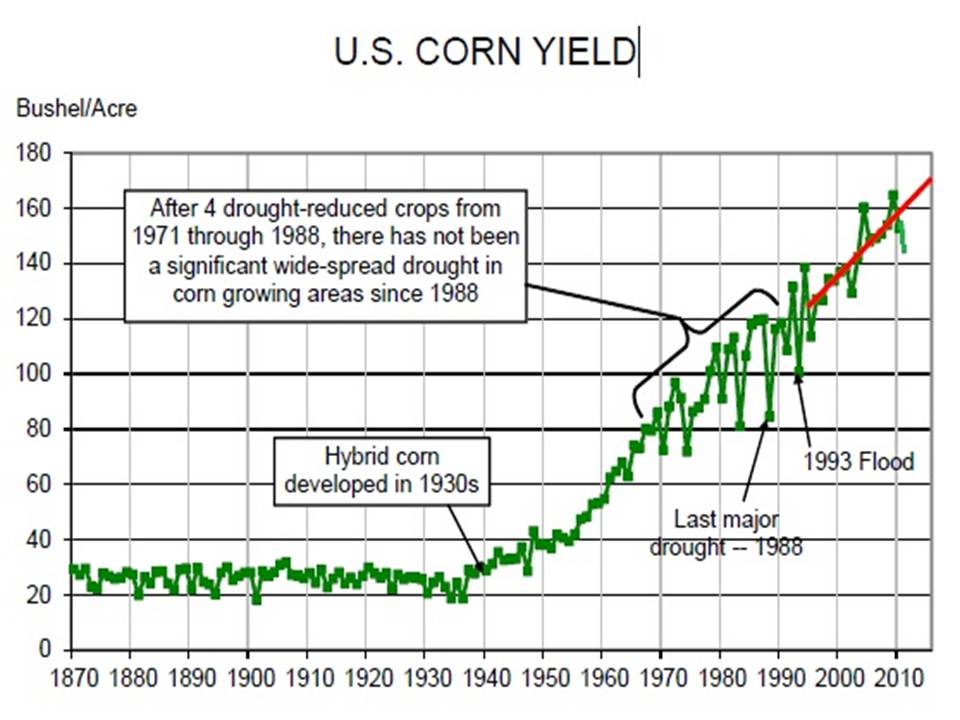
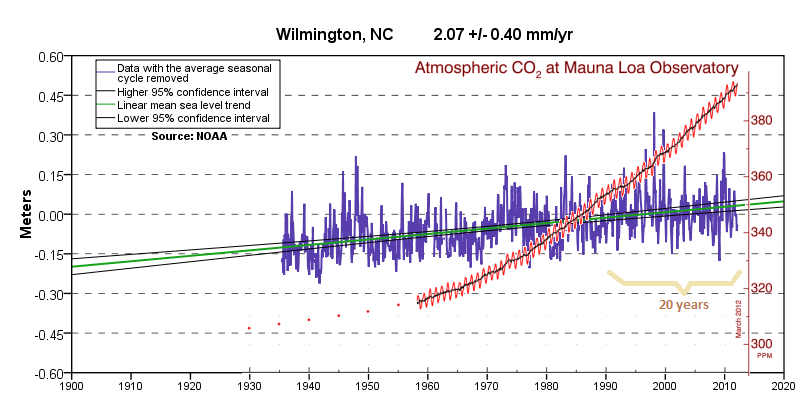
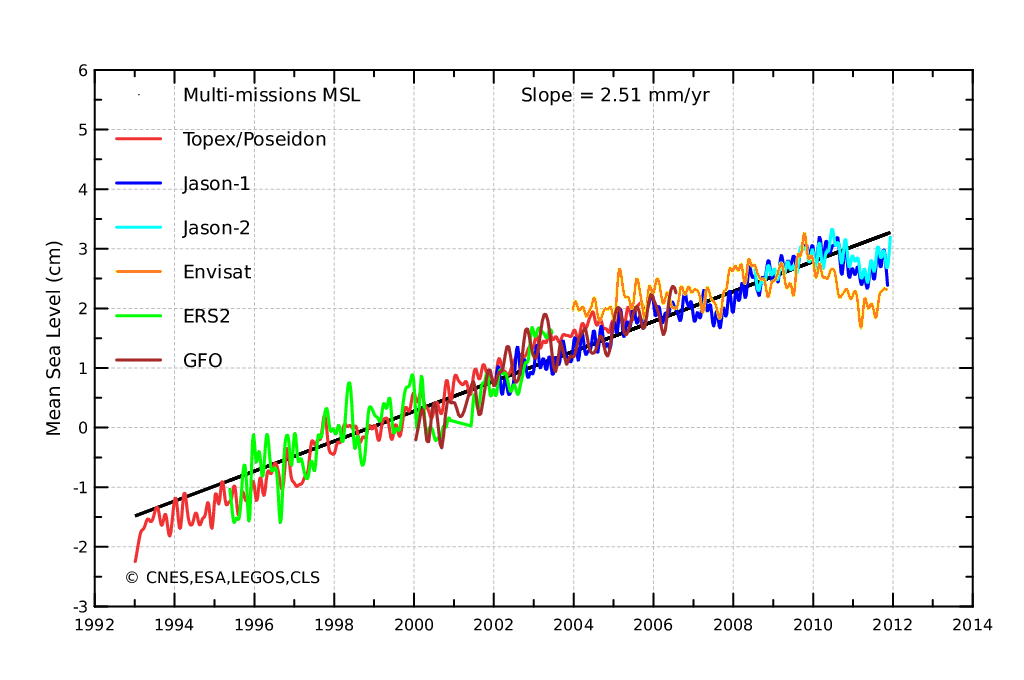
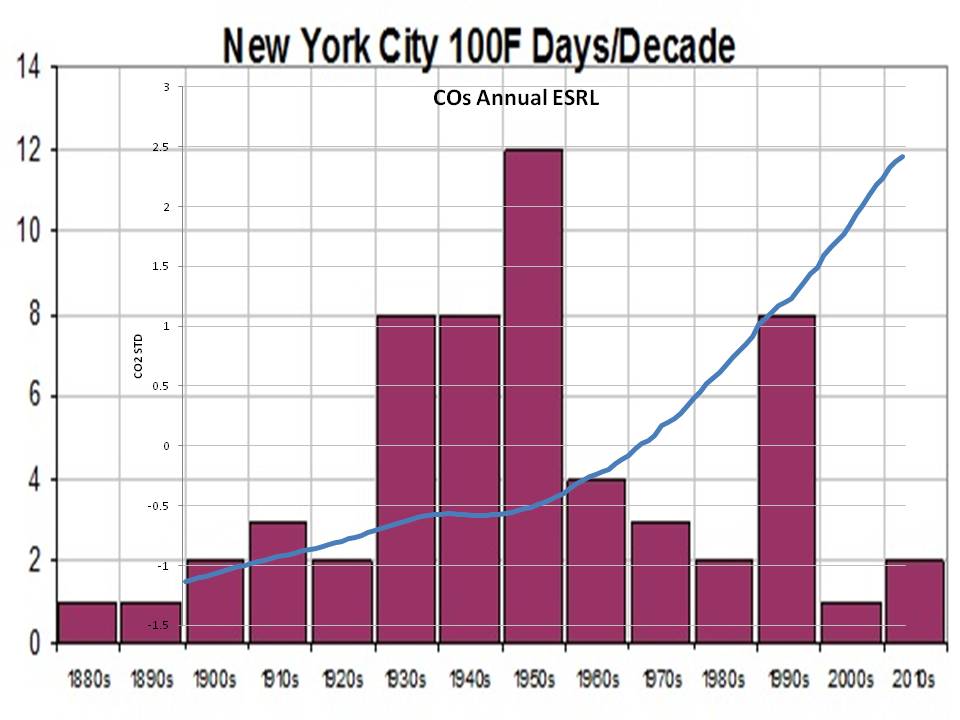
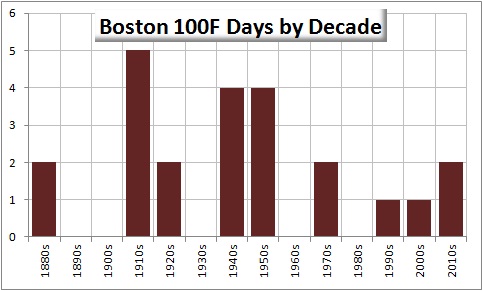
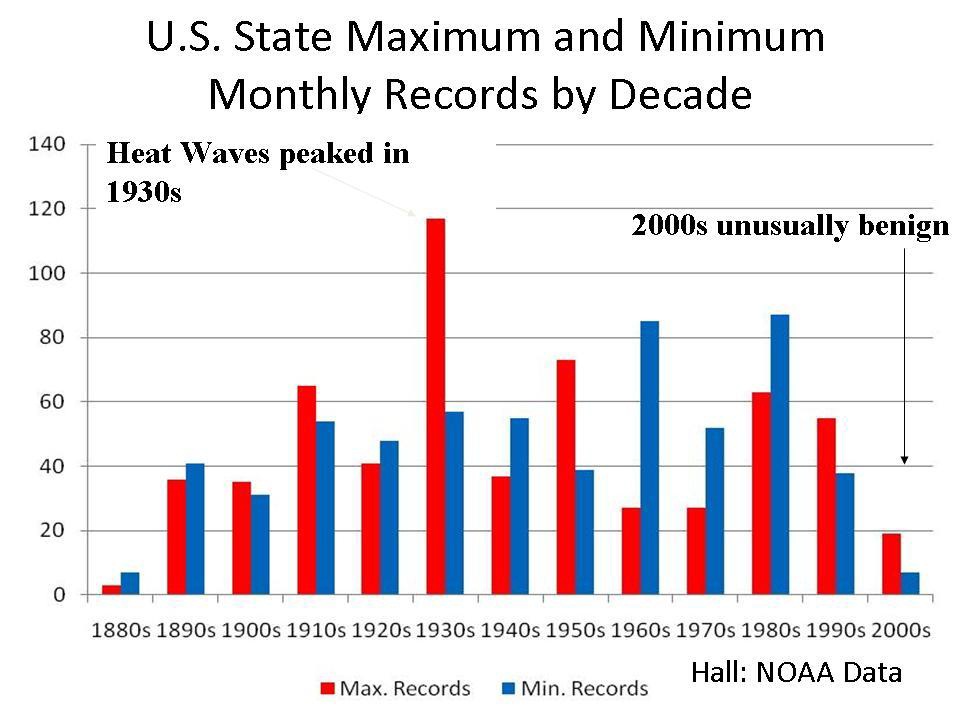
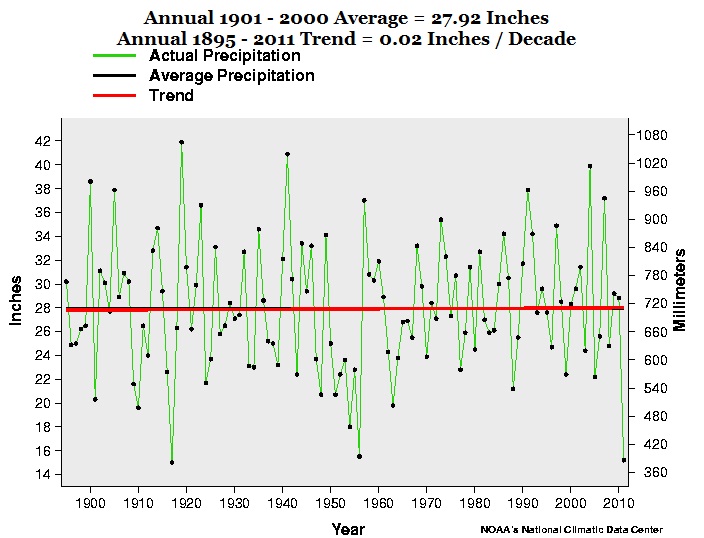
Let’s see the tune Biello plays in winter when the snow and cold invade North America and the lower 48 states as a weak El Nino comes on. I am glad I cancelled my subscription to Scientific American and Science and Nature. You may wish to consider the same.
By Alan Caruba
There are books that have doomed millions to death. “Das Capital” by Karl Marx kicked off the worst economic system of the modern era, claiming the lives of millions of Russians and Chinese, along with others in the process.
Hitler’s “Mein Kampf” mobilized Nazi Germany, led to World War Two in Europe, and was responsible for the deliberate killing of six million Jews and another five million Christians in its concentration camps, not counting the millions more in war dead. The Nazi leaders were ardent environmentalists.
This year marks the 50th anniversary of the publication of “Silent Spring” by Rachel Carson; a book that is credited with giving rise to the environmental movement in general and, in particular, America’s unfounded fears of pesticides, especially DDT.
Eight years would pass between its publication and the first Earth Day in 1970 that mobilized the beginning of the environmental movement by putting government muscle behind it with the creation of the Environmental Protection Agency.
“Silent Spring at 50: The False Crises of Rachel Carson” ($25.95, Cato Institute) has a publication date in September, but given the June 20-12 Earth Summit in Rio de Janeiro, it is particularly timely. Its chapters had titles like “Elixirs of Death”, “Needless Havoc”, and “Rivers of Death.” What their content lacked was real science and real facts.
DDT was already famous for protecting human health along with a whole range of agricultural chemicals that protected crops against the depredation of insects, rodents and weeds. The book has rightly been condemned for the deaths- literally millions - that have resulted since the 1972 U.S. ban of DDT by the Environmental Protection Agency. It “was firmly and repeatedly warned by public health officials of the United States, the World Health Organization, and the Pan American Health Organization of disastrous consequences of a DDT ban.”
Even today, the EPA either manufactures or ignores evidence to justify its regulations.
Its inventor, Dr. Paul Muller, received a Nobel Prize in 1948 in recognition of the role DDT played in saving hundreds of thousands of lives of troops fighting the Axis in World War Two and the survivors of the Nazi death camps. It killed the insects that spread Typhus and other diseases. It did so without any evidence of the bogus threat of cancer that Carson advanced.
Nine contributors to “Silent Spring at 50” make a powerful case for the harm Carson’s obsessive fear of what were widely known to be beneficial chemicals. The book is a classic example of bogus science combined with deliberate lies to frighten people. That has always been the modus operendi of the environmental movement.
“Carson would have known of the great public health achievements of DDT and that it was saving lives,” writes Donald R. Roberts and Richard Tren, the authors of one chapter. “Indeed she describes some of the programs in “Silent Spring.” But the bulk of the book is a singular attack on DDT and other insecticides with scarcely any recognition of their actual and potential benefits.”
In the first chapter of “Silent Spring”, titled “A Fable for Tomorrow”, Carson invents a town so poisoned by insecticides that no birds sing there, having all been wiped out. It is pure fiction. Subsequent studies have demonstrated that the die-off she described has never happened. Years of bird counts refute that charge. Indeed, agricultural pesticides had initially been regulated by Congress in 1910 and generations of farmers took care to avoid contaminating their crops for obvious reasons.
The anniversary of the book’s publication is relevant to everyone today, even those born since the DDT ban. The coast-to-coast plague of bedbugs that has occurred in the past decade and continues today could have been eliminated if DDT was still in use. The mainstream media reported the plague, but never mentioned this salient fact, nor the fact that the EPA has just one pesticide registered for use against bedbugs and routinely refused to allow licensed pest control professionals to use it.
Carson kicked off “the precautionary principle” cited by environmental groups and government agencies that, in effect, leaves the public defenseless against the health threats that Mother Nature provides in the form of insects and rodents known to spread disease, or mold-contaminants such as aflatoxin, many times more toxic than the fumigant that was banned to control it.
Malaria, once on the brink of being eliminated, has long since made resurgence since the ban of DDT, although some nations most affected by the disease have received permission to use it.
That is Rachel Carson’s true and lethal legacy.
It is why so much of what the environmental movement advocates, from the United Nations to non-governmental-organizations like Greenpeace, the Sierra Club, Friends of the Earth, the World Wildlife Fund, and dozens of others always seems to end up killing people in the name of saving the Earth.